This dashboard focuses on authentication sessions which have a motion score.
Basic Statistics
The first part of the dashboard contains the following charts, which can be used for filtering:
-
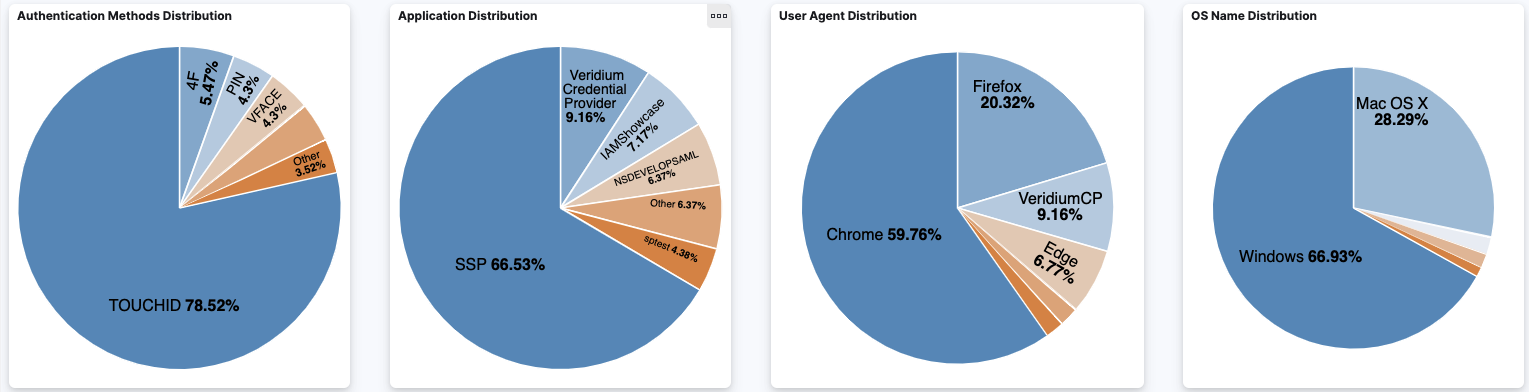
Authentication Method distribution is a pie chart which shows a overview of how many authentication sessions were created using each combination of authentication methods.
-
Application distribution is a pie chart which provides an overview of how many authentication sessions were created using each application.
-
The User Agent Distribution chart is a pie chart which shows an overview of how many authentication sessions were created using each user agent.
-
The OS Name Distribution is a pie chart which provides an overview of how many sessions were created using each user agent device operating system.
Motion chart
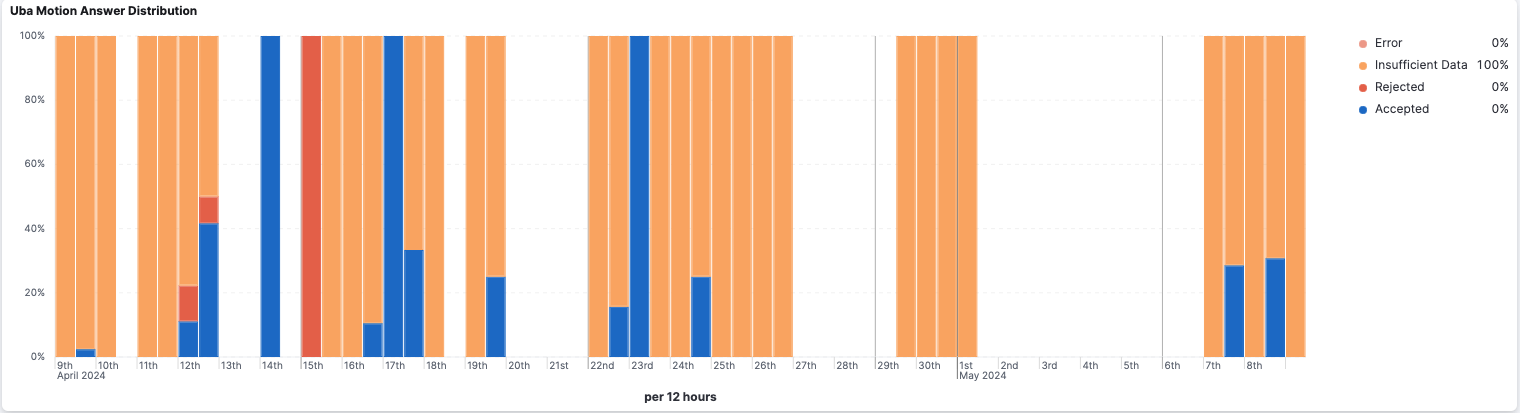
This part contains a distribution bar chart which shows the distribution of session’s motion answer in time.
Tables
This part of the dashboard contains the following tables:
-
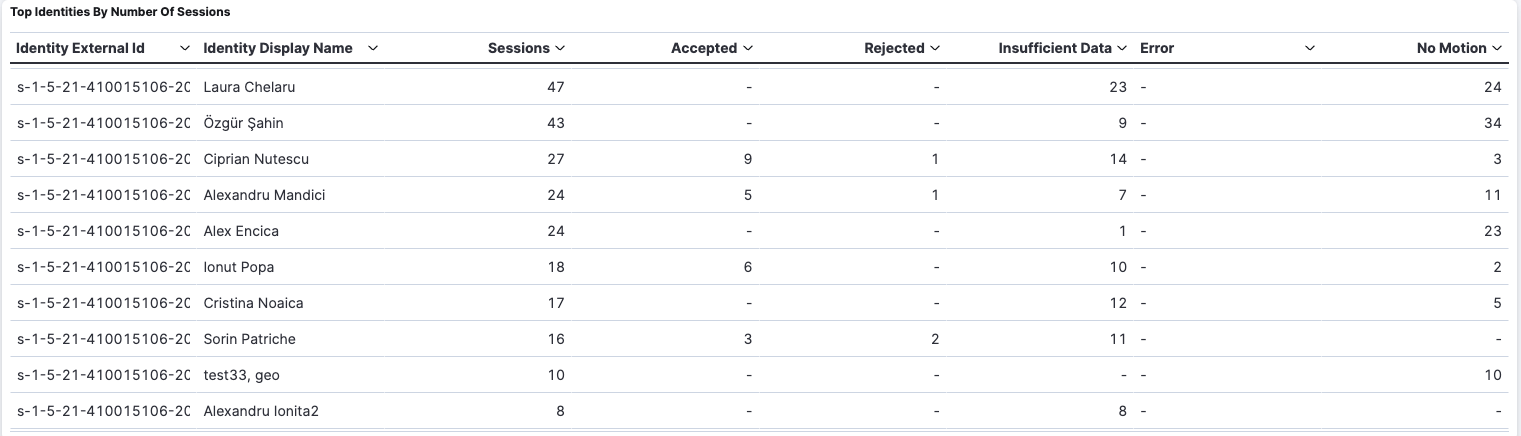
The “Top identities by number of sessions” aggregation table shows the authentication sessions grouped by Identity External Id and display name. For each identity, the number of sessions, and the count of sessions for each possible motion answer are computed. This table only shows the top 100 identities sorted by the number of sessions performed in the dashboard time range. The user can use this table to navigate to the Identity Details dashboard by using the “Identity External Id” column
-
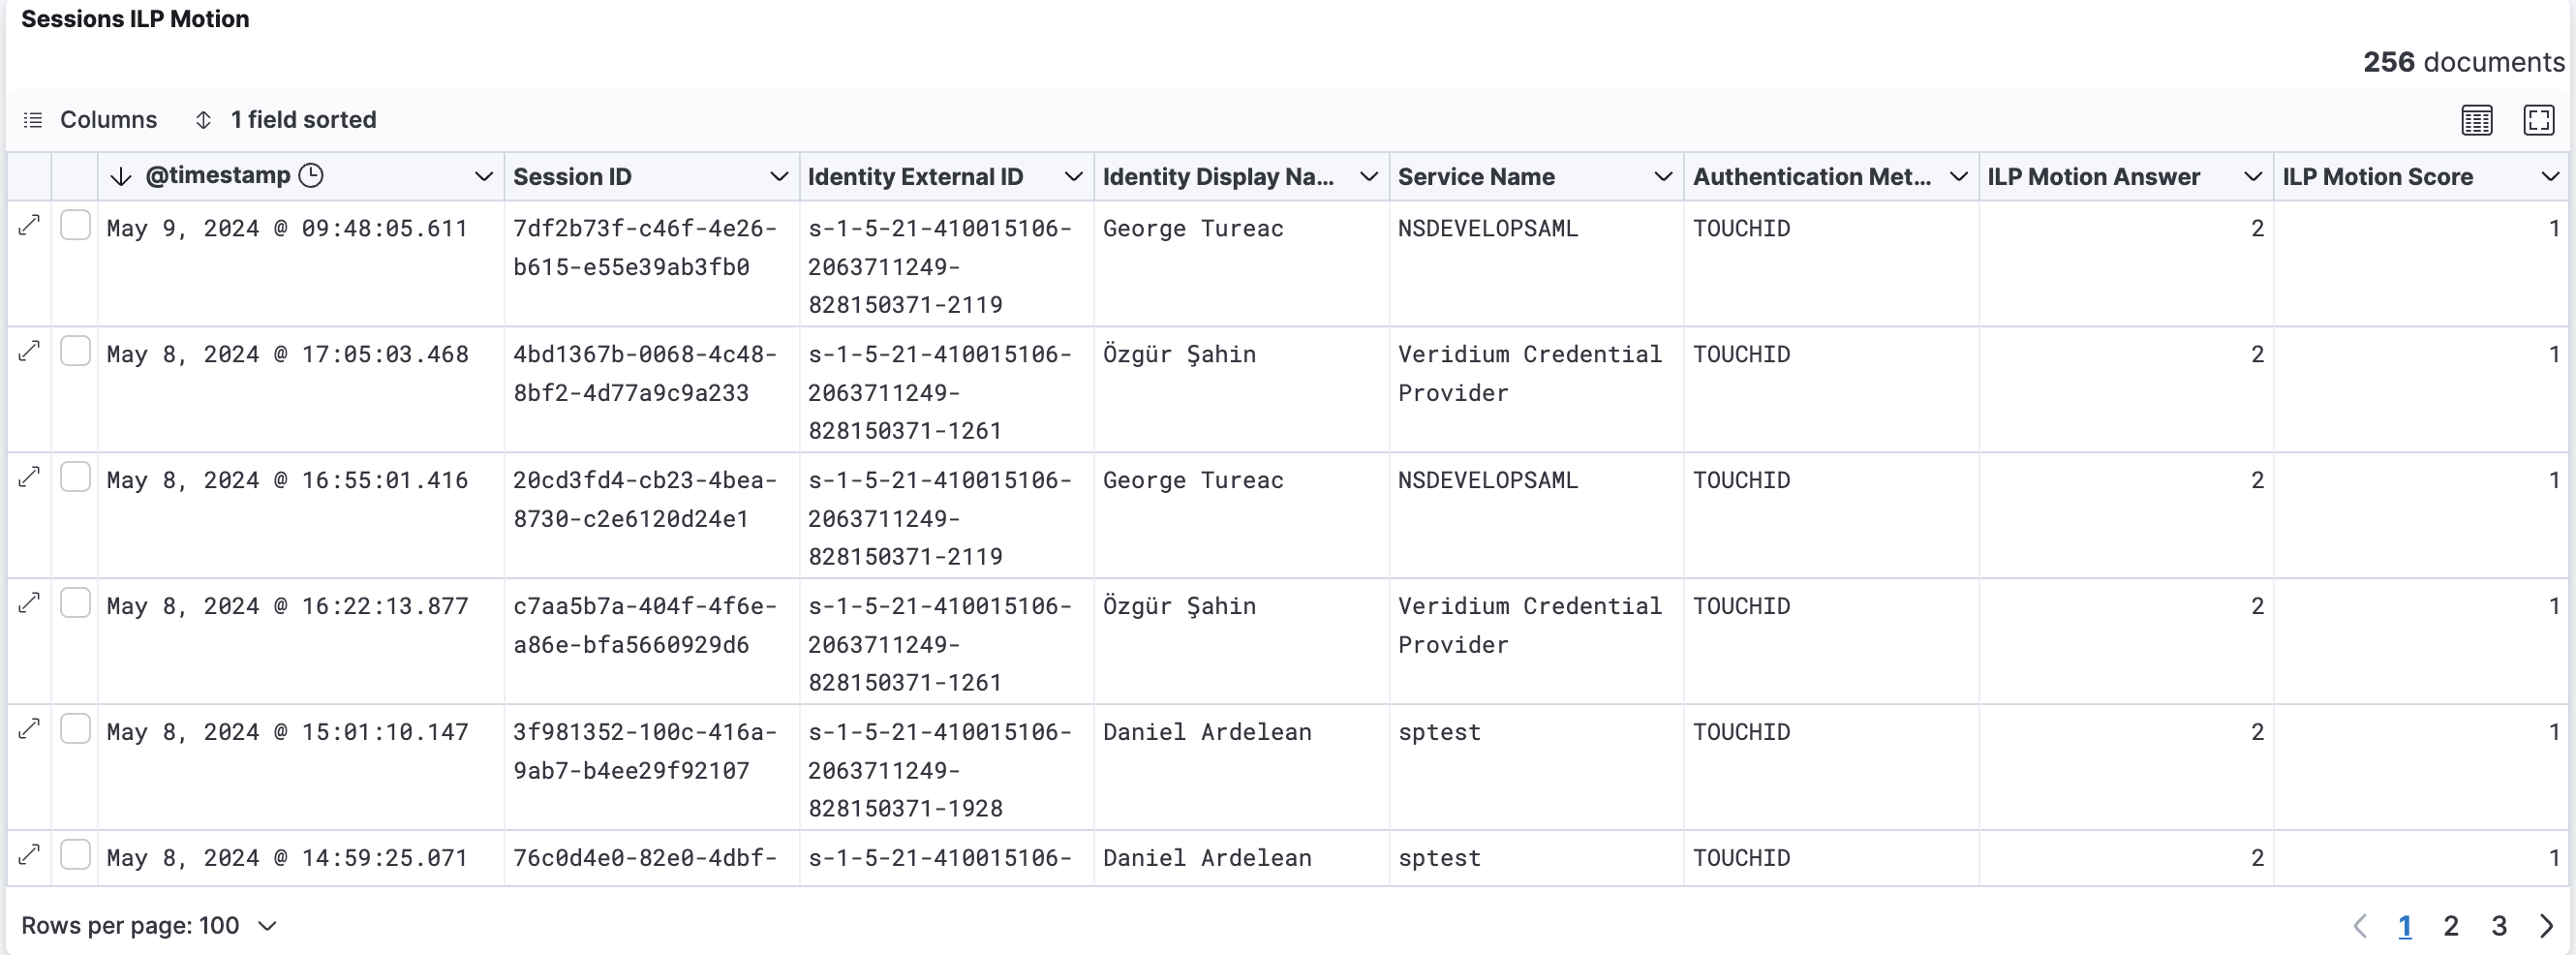
The “Sessions ILP Motion” table provides a list of the sessions performed, sorted by timestamp