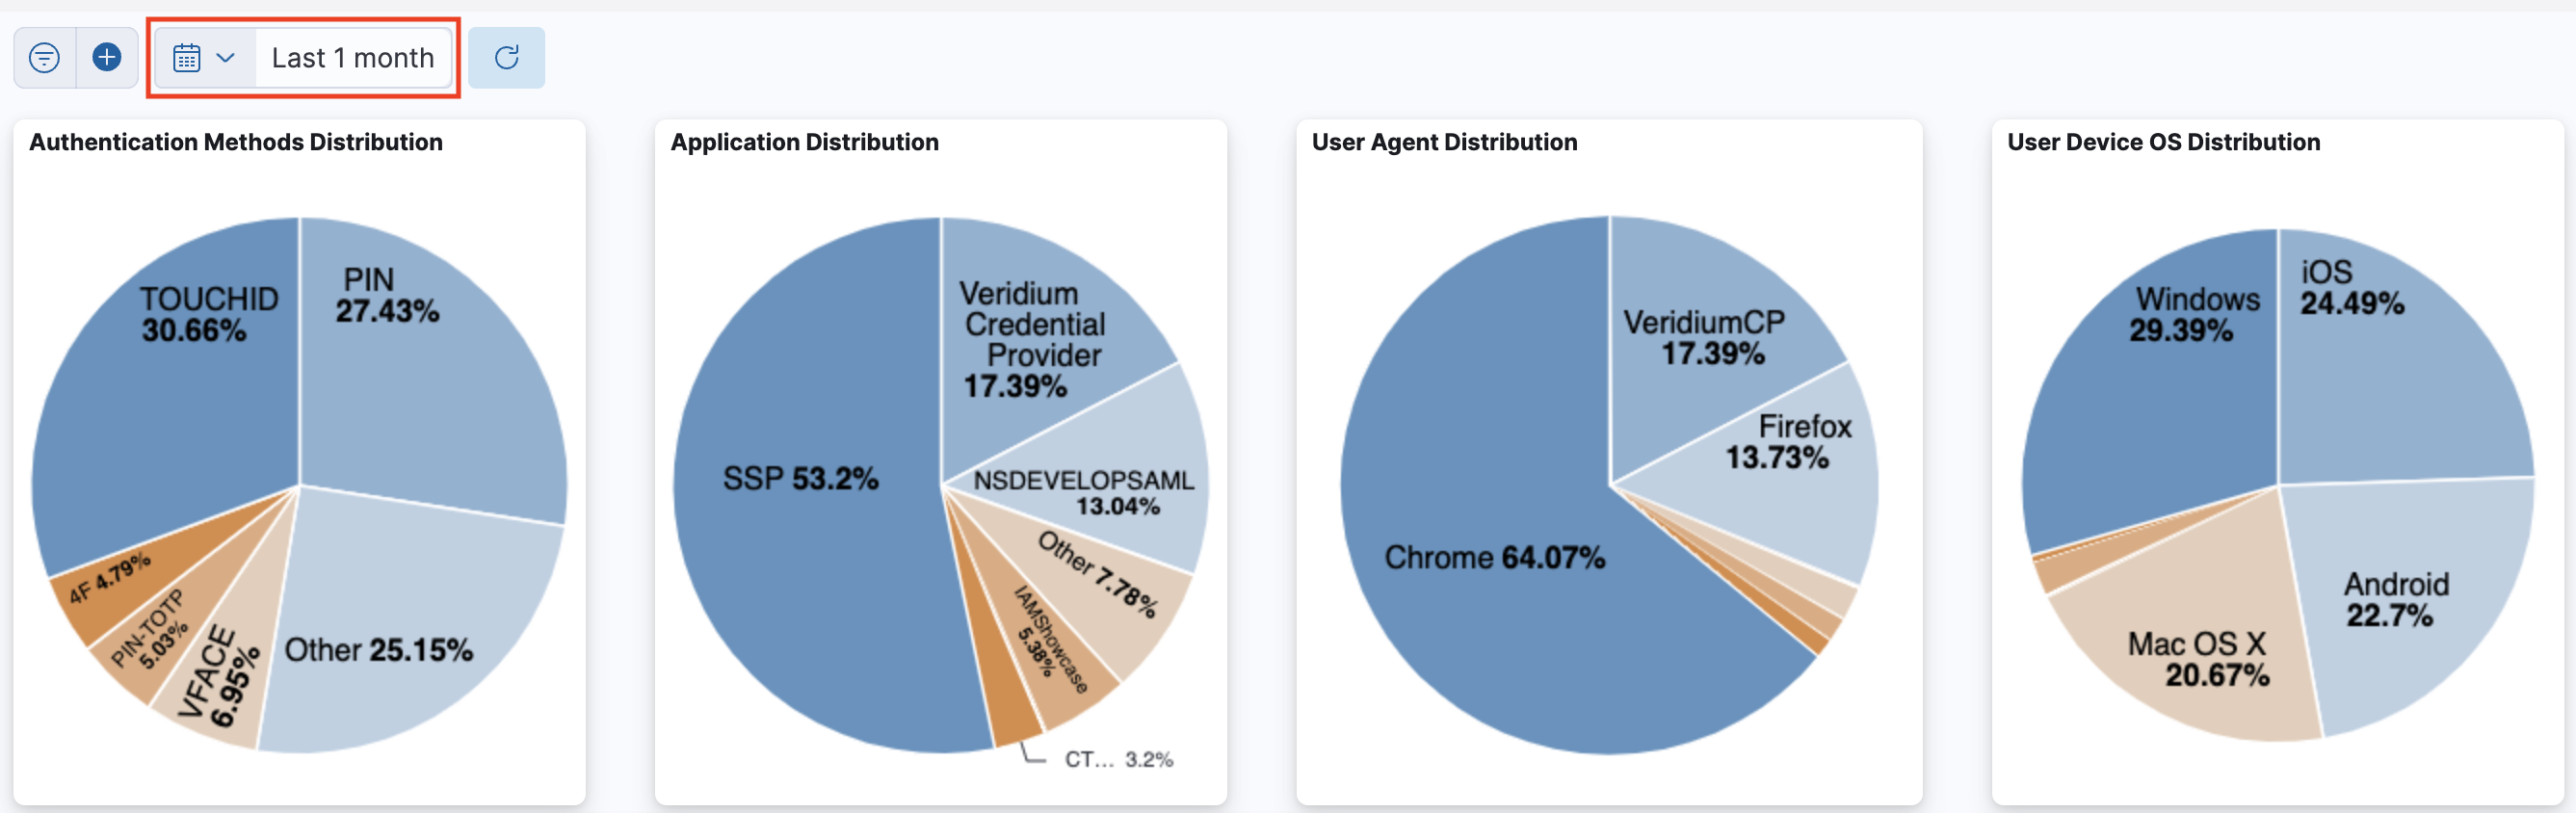
Time Range
Each dashboard has a global time range. Each chart in the dashboard only shows data about authentication sessions performed during this time range.
Filtering
Once the user applies a filter over the dashboard, this filter is applied globally, on all charts present in the dashboard.
For example, when the user clicks on a pie chart slice, a global filter is applied.
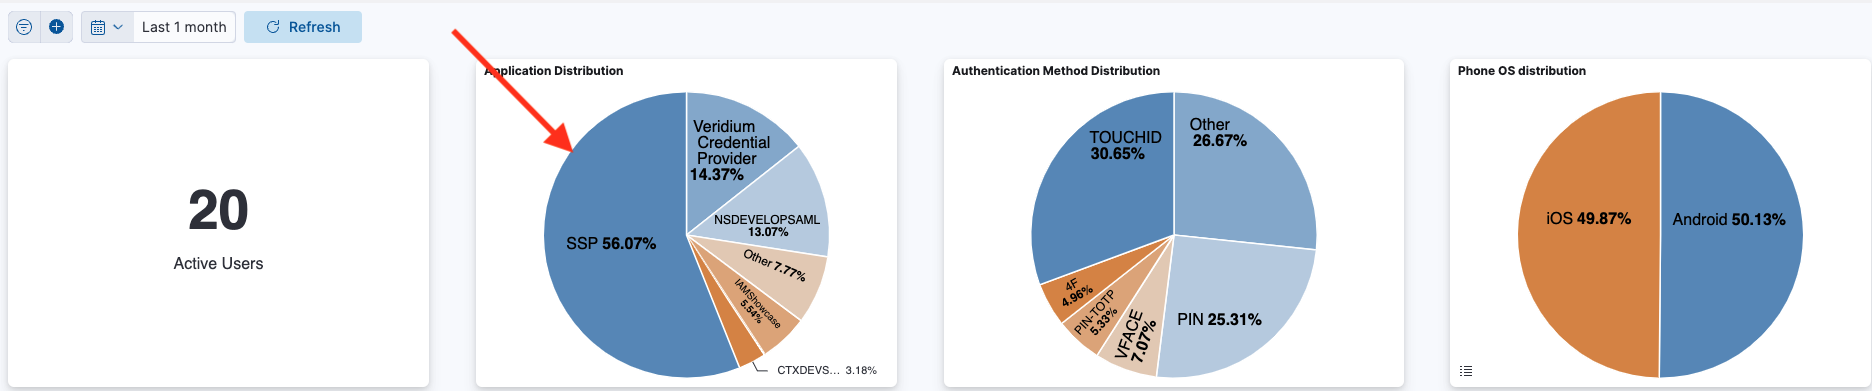
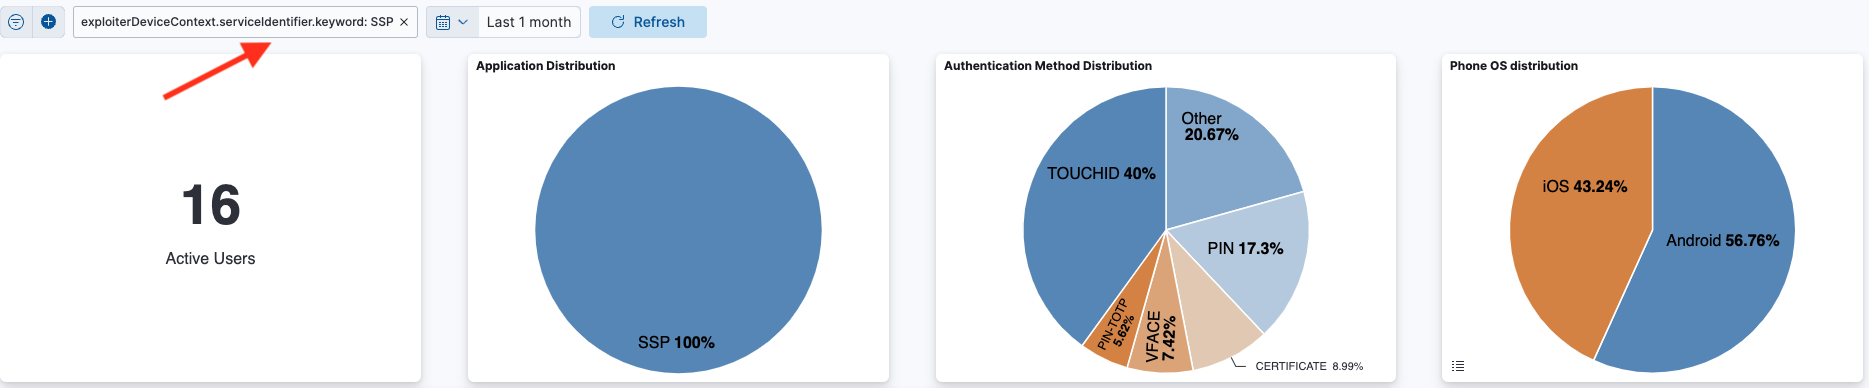
It can be seen that the other charts are affected by this filter too. For example, initially there were 20 users that created sessions over the last month, but after filtering it can be seen that only 16 of them have used SSP at least once.
Panel Options
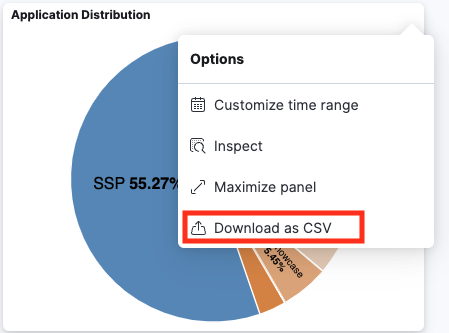
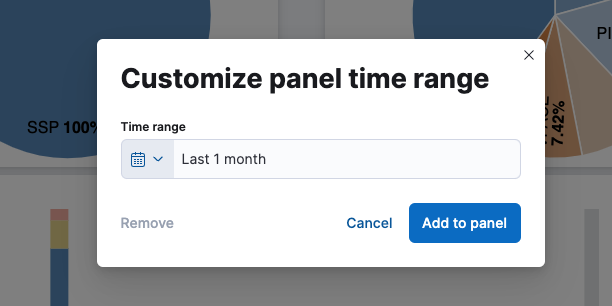
The time range for a panel may be changed from the “Customize time range button”. A popup appears that allows setting a new time range which overwrites the dashboard’s global time range.
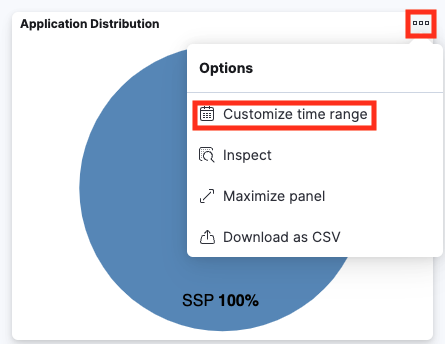
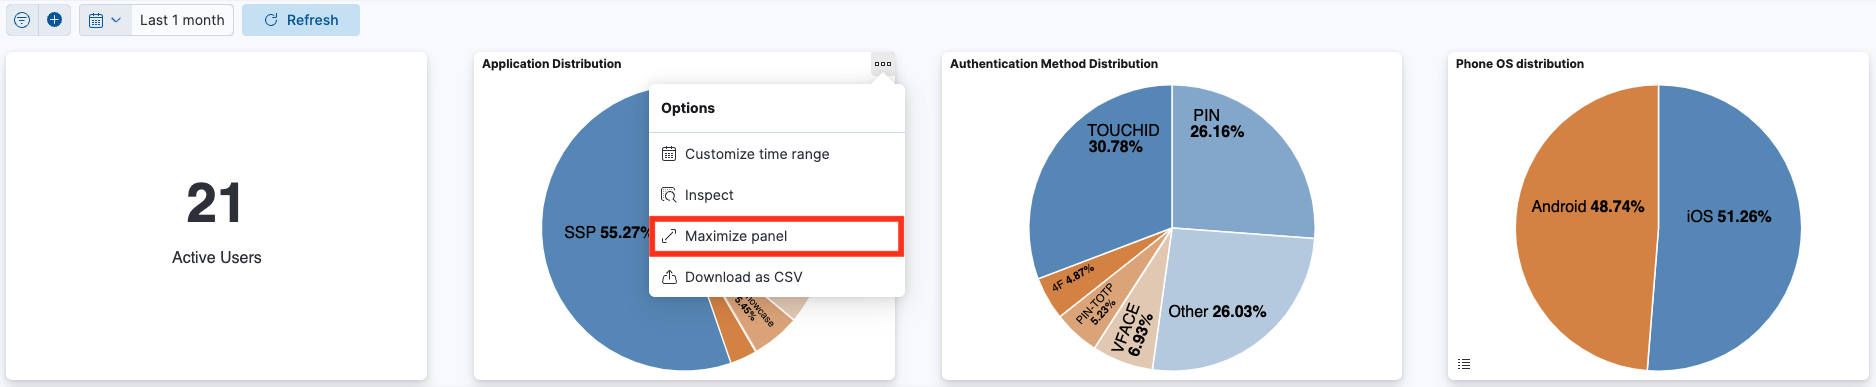
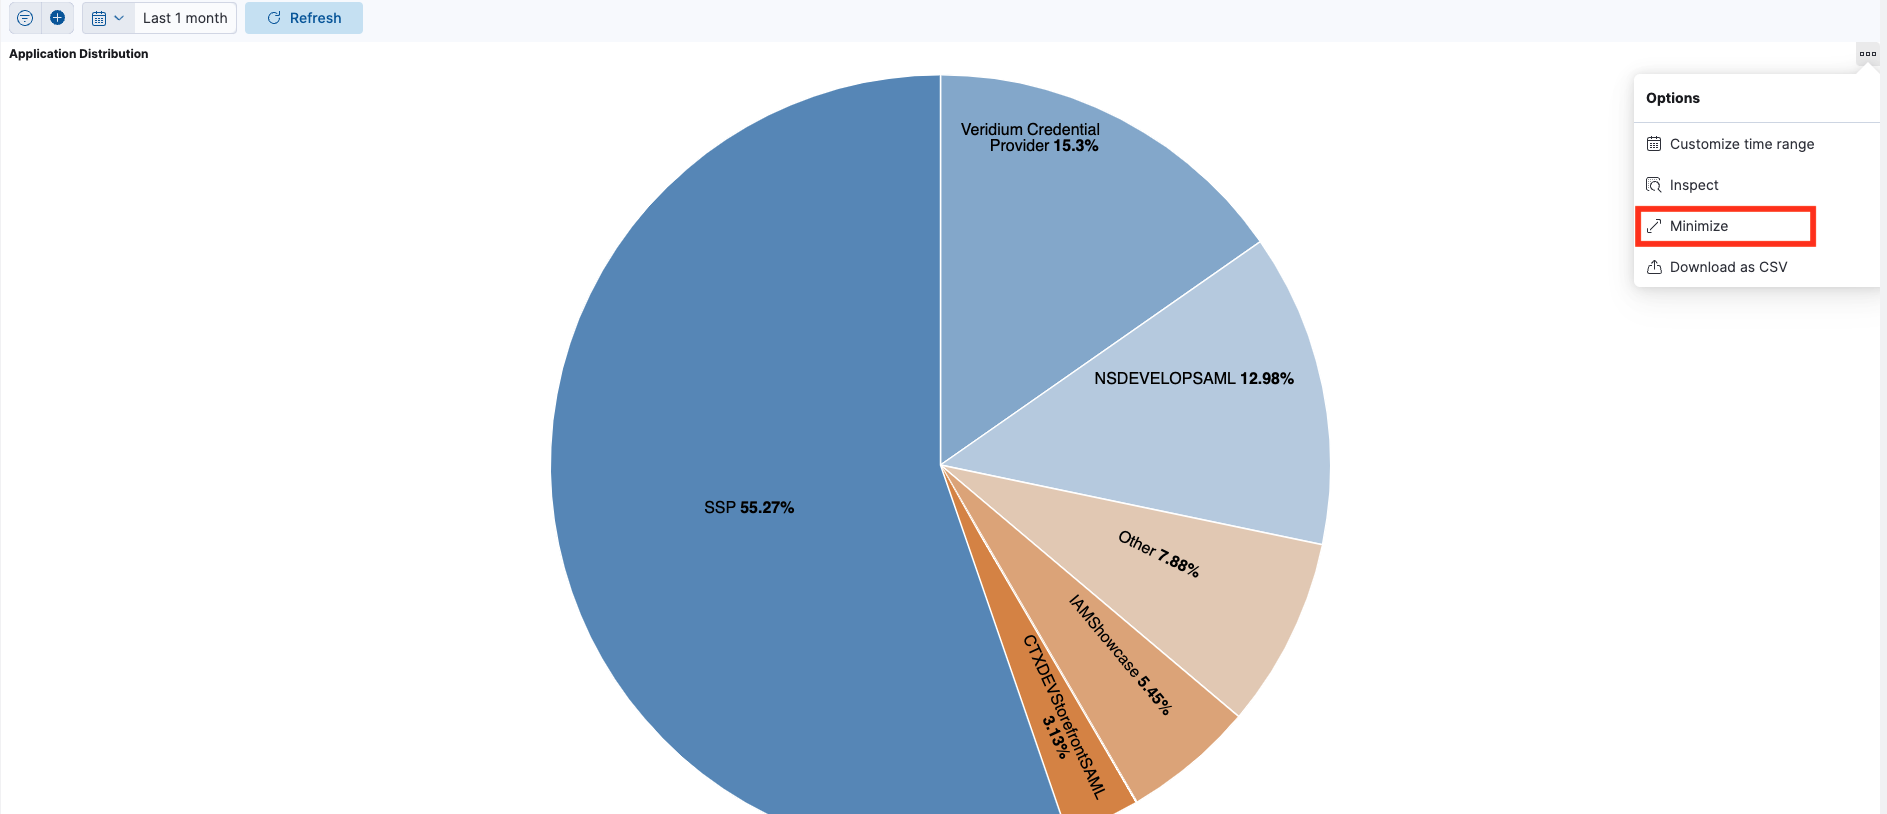
The panel can also be maximized to cover the entire screen from the “Maximize panel” button, and minimized back using the “minimize” button.
The data used to render the panel may be also downloaded in CSV format.