This dashboard shows charts about sessions performed with a phone as an authenticator device.
Basic Statistics
This part contains the following charts:
-
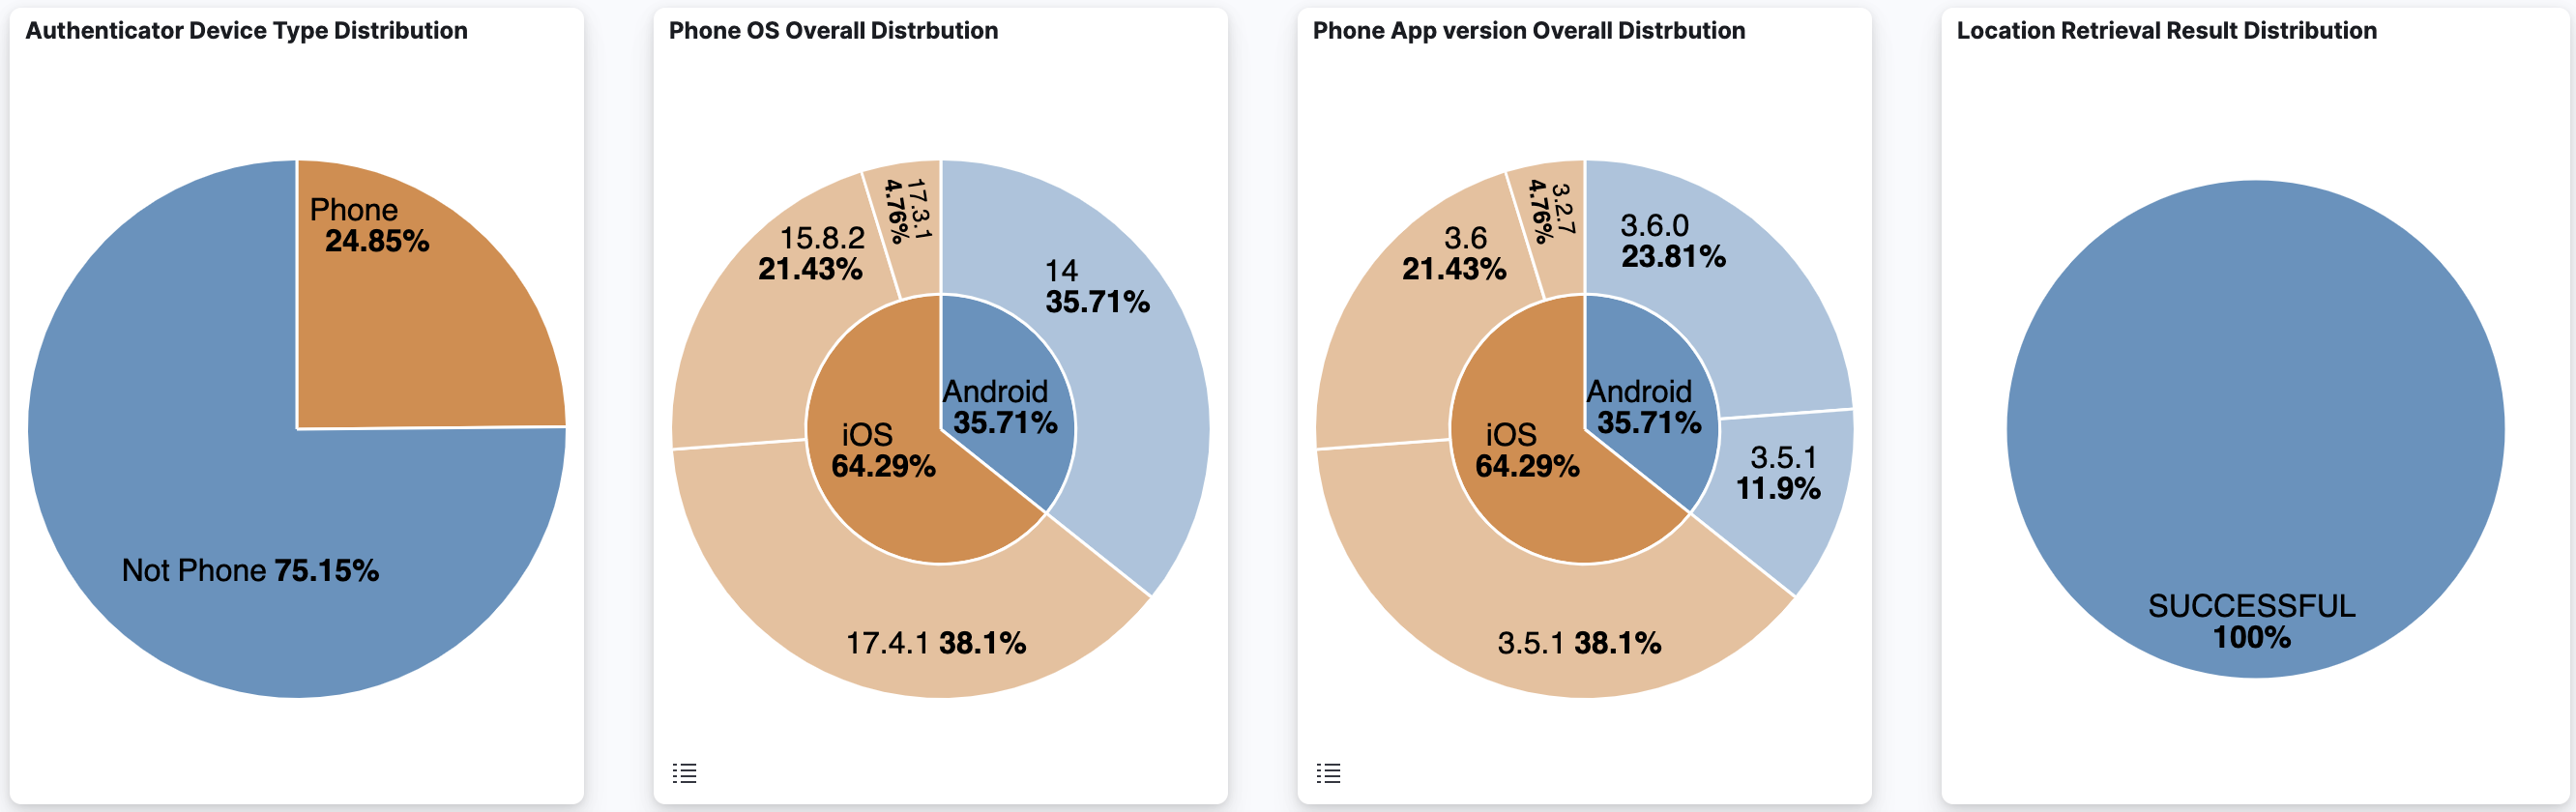
The “Authenticator Device Type Distribution” is a pie chart which shows the distribution of sessions which are done and not done with a phone authenticator device
-
The Phone OS overall distribution is a multi-layer pie chart showing the total session count per OS name and version
-
The Phone App version overall distribution is a multi-layer pie chart showing the total session count per OS name and Veridium App version
-
The “Location Retrieval Result Distribution” is a pie chart that shows, taking into account only phone sessions, how many such sessions successfully inferred the location and how many didn’t
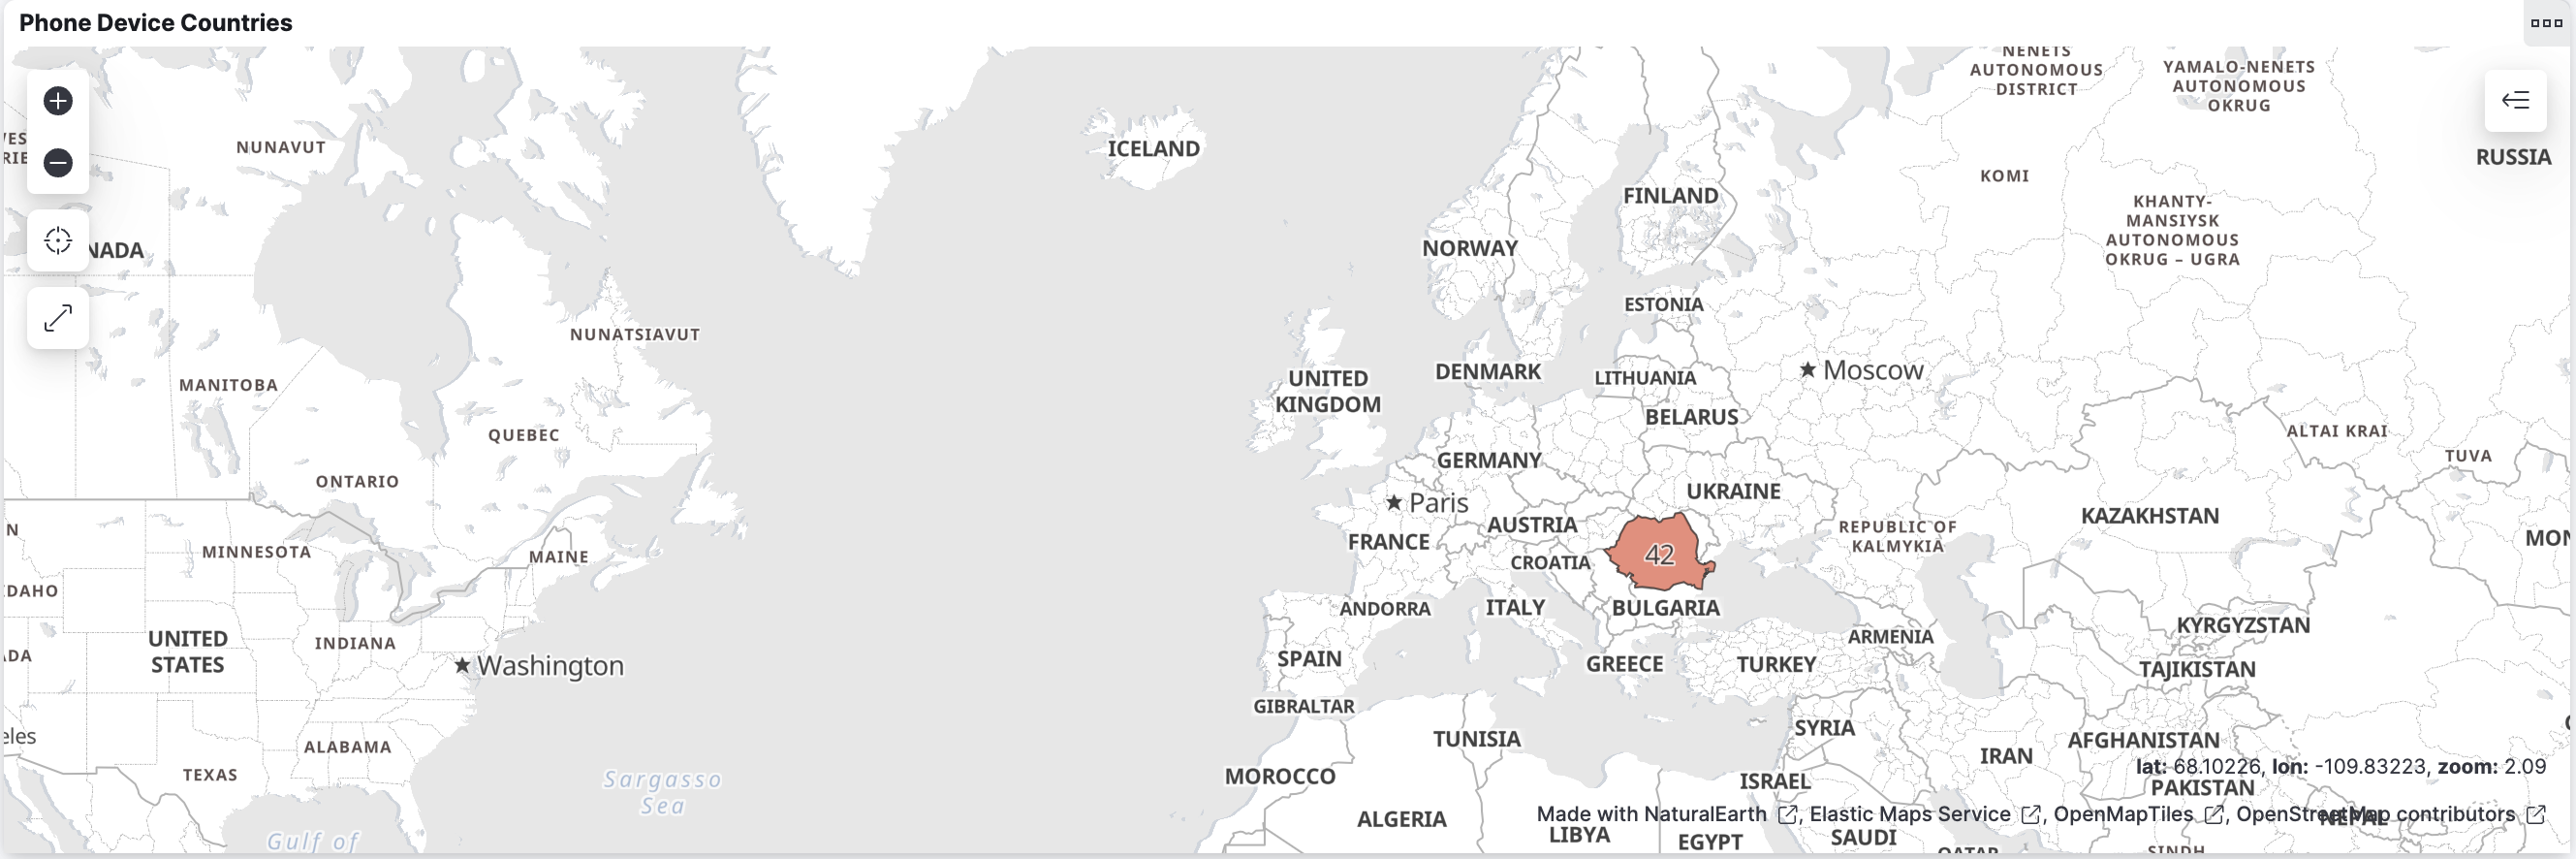
Phone locations
This chart takes into account only phone sessions and depicts their location into a country map.
Tables
This part of the dashboard contains the following tables:
-
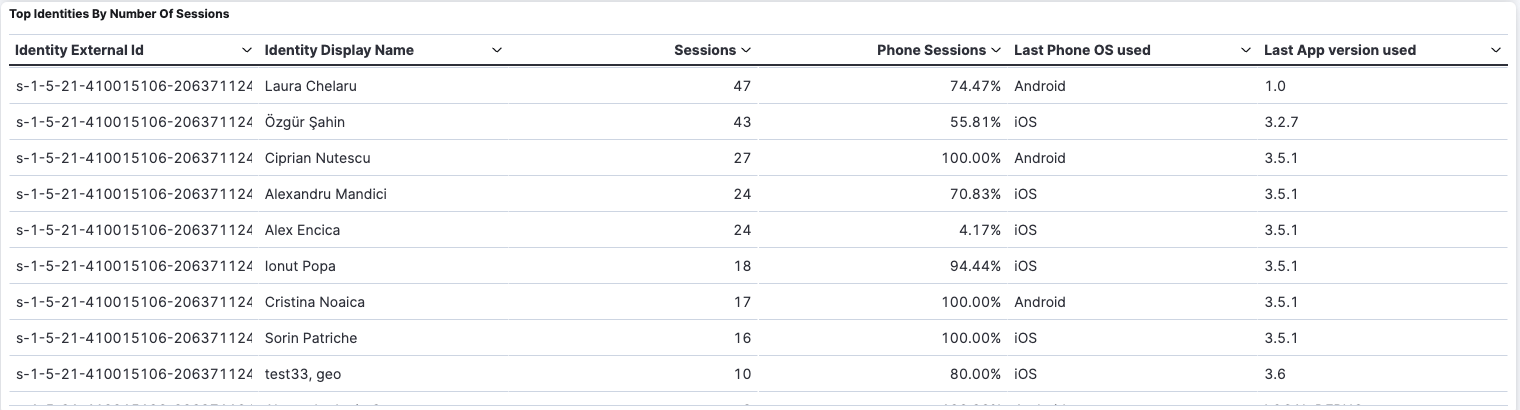
The “Top identities by number of sessions” aggregation table shows the authentication sessions grouped by Identity External Id and display name. For each identity, the number of sessions, the percentage of phone sessions, the last Phone OS used and the last Veridium App version used are computed. This table only shows the top 100 identities sorted by the number of sessions performed in the dashboard time range. The user can use this table to navigate to the Identity Details dashboard by using the “Identity External Id” column
-
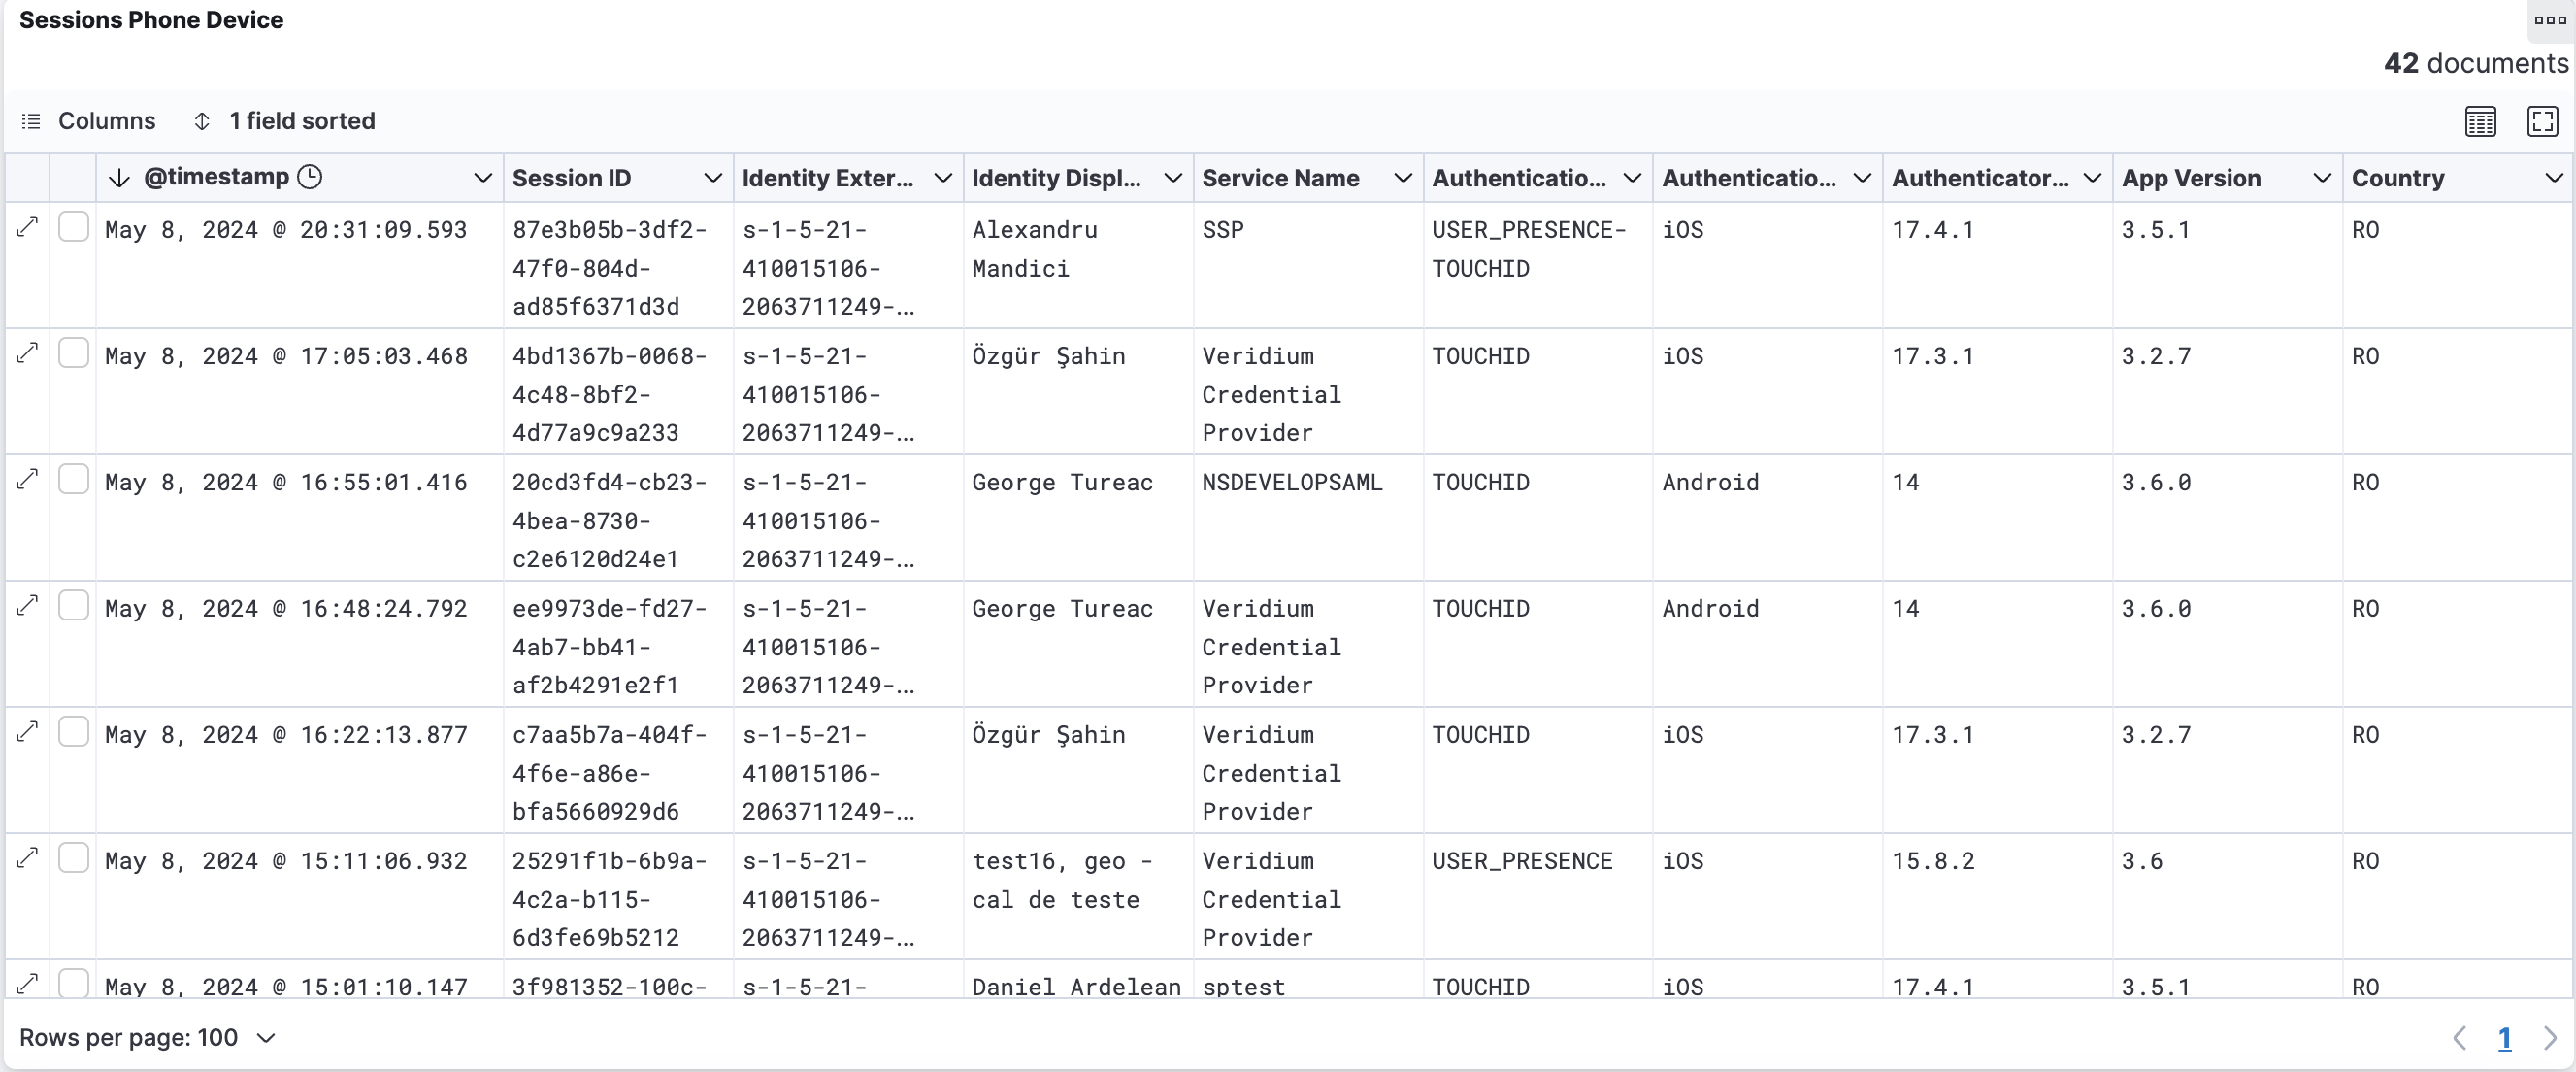
The “Sessions Phone Device” table provides a list of the sessions performed, sorted by timestamp, taking into account only phone devices.