This chart focuses on the user agent device used for performing the authentication session.
Basic Statistics
-
“OS name and version distribution” is a multi-layer pie chart which shows the count of authentication sessions grouped first by OS name and then by the OS version of the user agent device
-
The User Agent Distribution chart is a pie chart which shows an overview of how many authentication sessions were created using each user agent.
-
“Agent Trust distribution” is a pie chart which shows how many sessions were done using a trusted agent and how many were not
-
Application distribution is a pie chart which provides an overview of how many authentication sessions were created using each application.
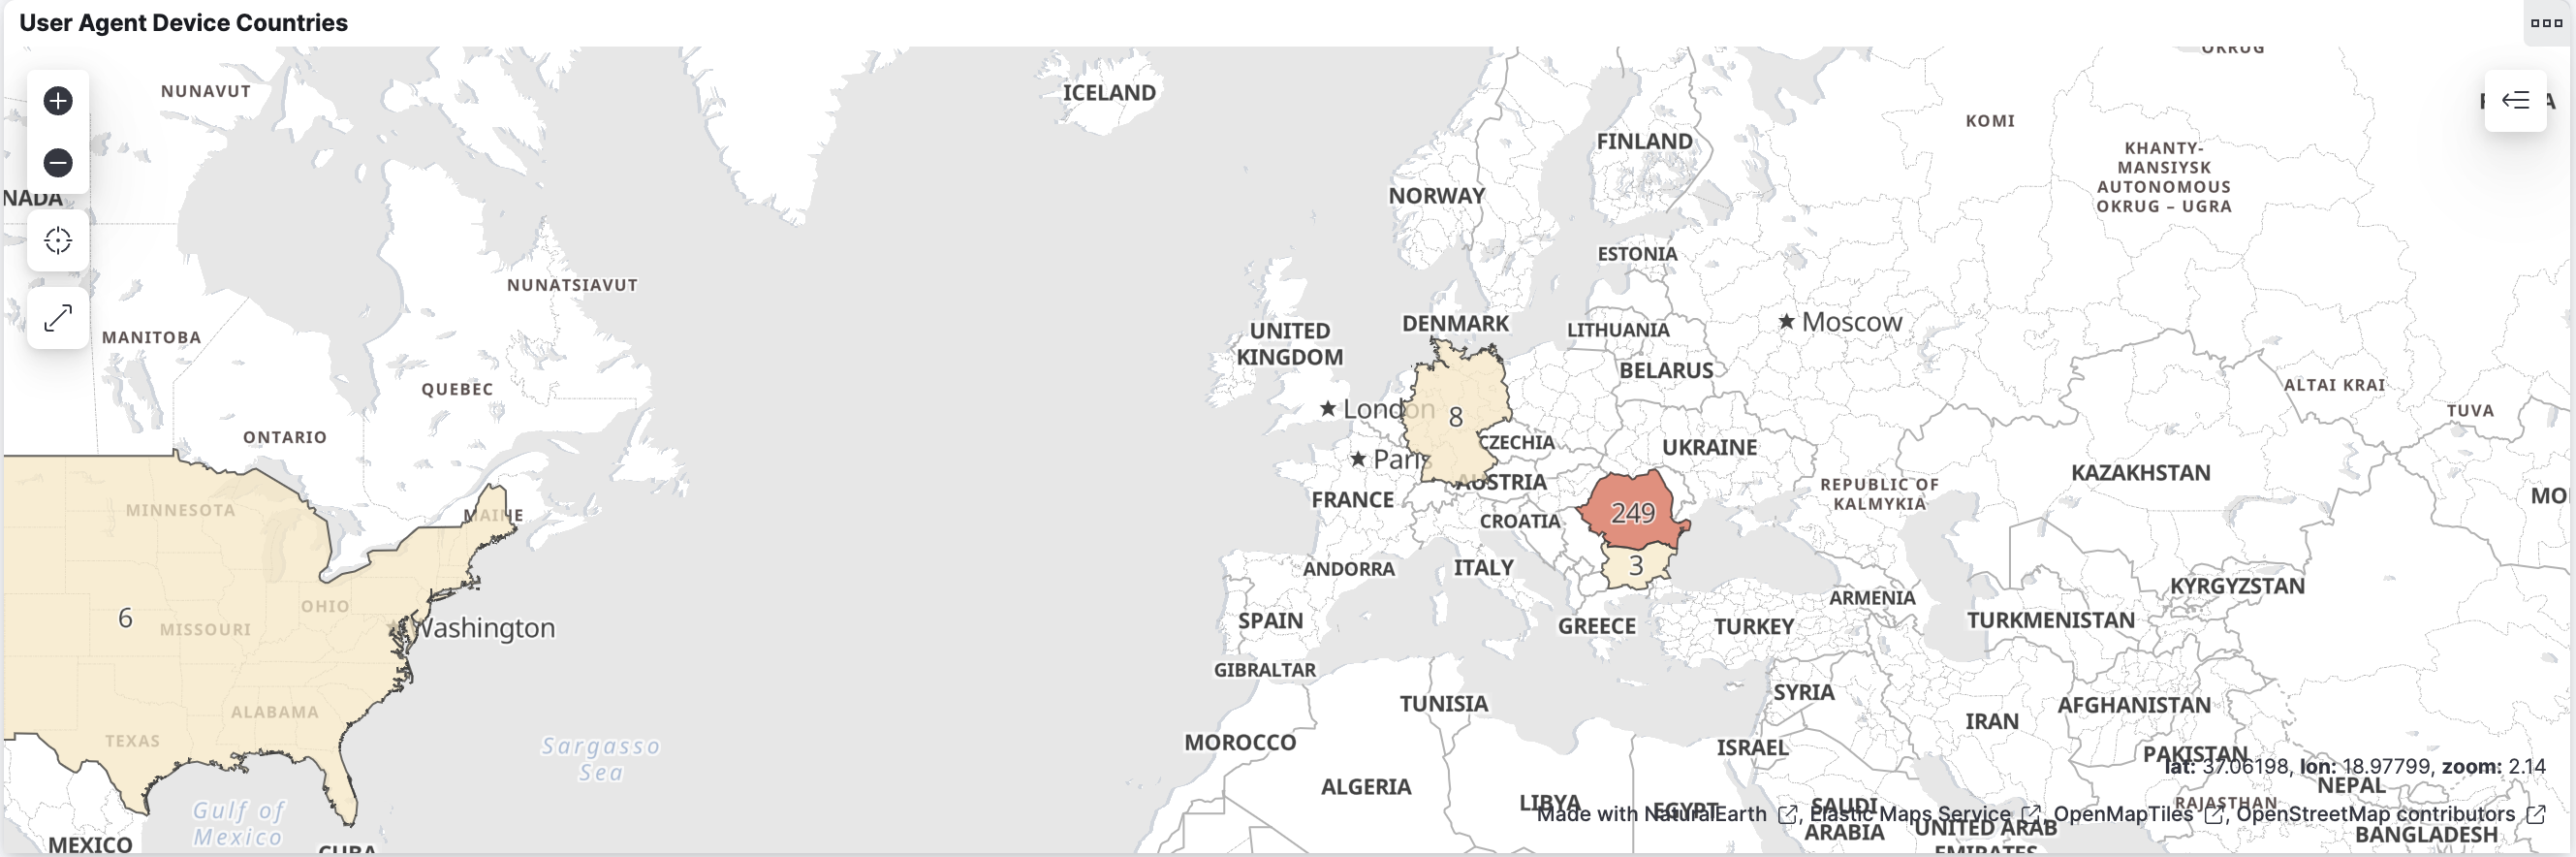
User agent device locations
This chart depicts the location of each session’s user agent device into a country map.
Tables
This part of the dashboard contains the following tables:
-
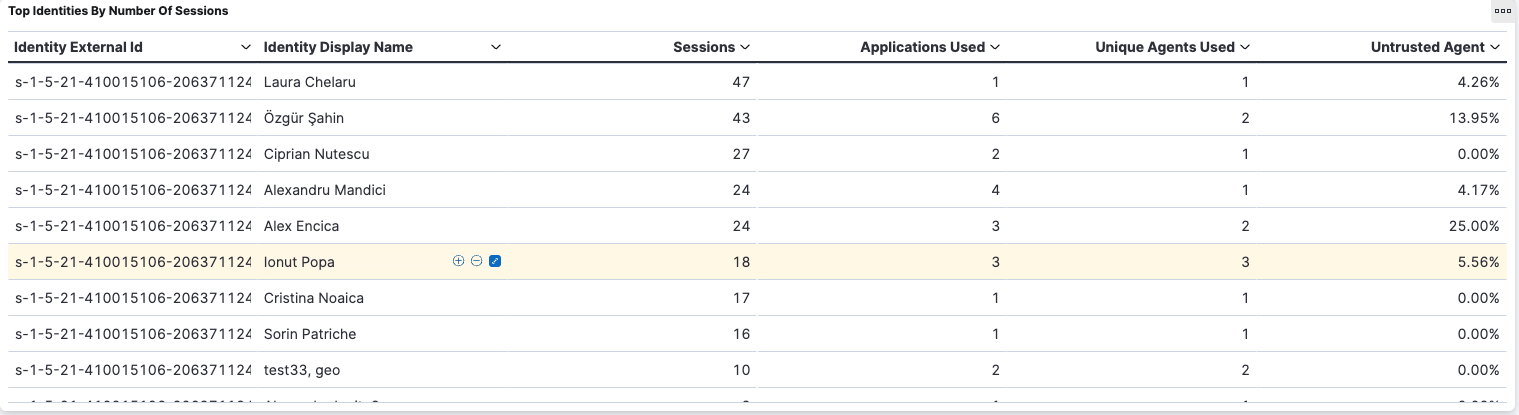
The “Top identities by number of sessions” aggregation table shows the authentication sessions grouped by Identity External Id and display name. For each identity, the number of sessions, the number of distinct applications used, the number of distinct user agents used and the percentage of untrusted agents sessions are computed. This table only shows the top 100 identities sorted by the number of sessions performed in the dashboard time range. The user can use this table to navigate to the Identity Details dashboard by using the “Identity External Id” column
-
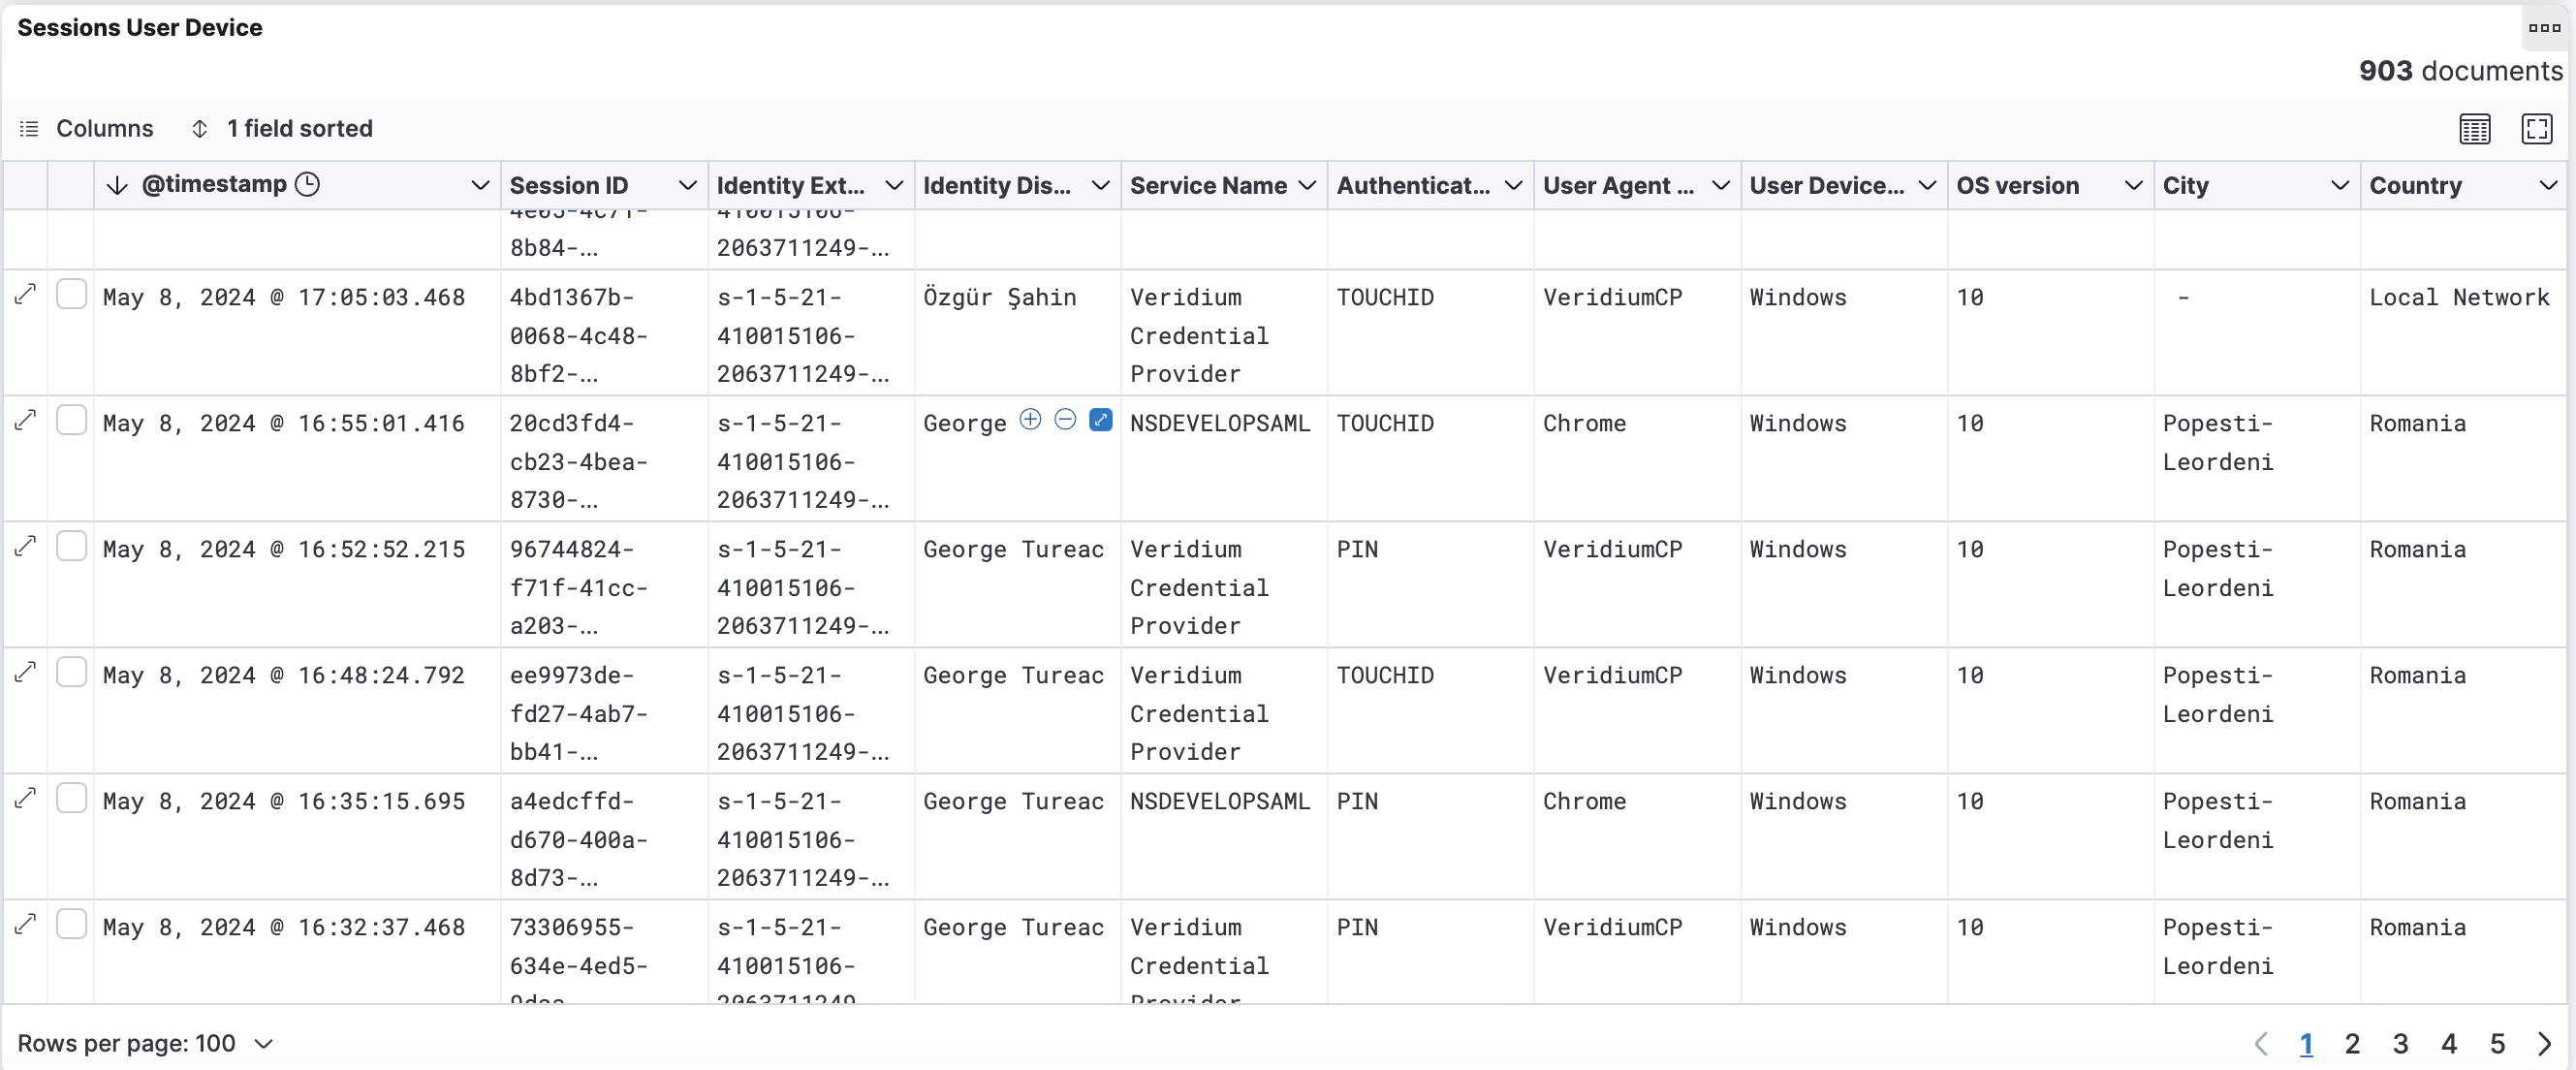
The “Sessions User Device” table provides a list of the sessions performed sorted by timestamp