

This document summarizes observed performance results for VeridiumID server workloads, including user registration, SAML login, and Windows Credential Provider (CP) operations.
How to read these results
Results are provided for the tested configurations and workloads only. Actual performance may vary based on deployment topology, infrastructure, network conditions, data volumes, and workload characteristics.
Test environment
|
Component |
Configuration |
|---|---|
|
Application tier |
Two web application nodes with either 4 or 8 vCPUs per node |
|
Persistence tier |
Three persistence nodes with either 4 or 8 vCPUs per node |
|
Supporting services |
Tomcat: 6 GB; Cassandra: 6 GB; Elasticsearch: 4 GB |
|
Performance test server |
36 vCPUs and 16 GB RAM |
|
CPU |
QEMU Virtual CPU version 2.5+, 3,250 MHz |
|
Test execution |
Tests were executed using one web application node with 16 vCPUs. Session stickiness was configured at the IP level. |
Performance results
The table below presents the average response time, session throughput, and observed CPU utilization for each workload.
|
Workload |
Hardware configuration |
Concurrent tasks |
Users |
Average response time |
Throughput |
Observed utilization |
|---|---|---|---|---|---|---|
|
Registration |
2 web app nodes × 4 vCPU; 3 persistence nodes × 4 vCPU |
50 |
30,000 |
630 ms |
4,651 sessions/min |
Web app 60%; persistence 50%; database 93% |
|
Registration |
2 web app nodes × 4 vCPU; 3 persistence nodes × 4 vCPU |
100 |
30,000 |
1 s |
5,500 sessions/min |
Web app 70%; persistence 40%; database 90% |
|
Registration |
2 web app nodes × 8 vCPU; 3 persistence nodes × 8 vCPU |
100 |
30,000 |
1 s |
5,793 sessions/min |
Web app 60%; persistence 45%; database 91% |
|
SAML login |
2 web app nodes × 4 vCPU; 3 persistence nodes × 4 vCPU |
50 over 35 min |
30,000 |
780 ms |
4,300 sessions/min |
Web app 78%; persistence 55%; database 9% |
|
SAML login |
2 web app nodes × 4 vCPU; 3 persistence nodes × 4 vCPU |
100 over 35 min |
30,000 |
1.25 s |
4,600 sessions/min |
Web app 85%; persistence 65%; database 9% |
|
SAML login |
2 web app nodes × 8 vCPU; 3 persistence nodes × 8 vCPU |
100 over 60 min |
30,000 |
750 ms |
7,600 sessions/min |
Web app 80%; persistence 50%; database 15% |
|
CP login and certificate generation |
2 web app nodes × 4 vCPU; 3 persistence nodes × 4 vCPU |
50 |
30,000 |
Not recorded |
Not recorded |
Not recorded |
|
CP login with cached certificate |
2 web app nodes × 4 vCPU; 3 persistence nodes × 4 vCPU |
50 |
30,000 |
400 ms |
7,200 sessions/min |
Web app 10%; persistence 20%; REAP server 98%; database 3% |
|
CP login with cached certificate |
2 web app nodes × 4 vCPU; 3 persistence nodes × 4 vCPU |
50 over 60 min |
30,000 |
400 ms |
7,500 sessions/min |
Web app 10%; persistence 20%; REAP server 98%; database 3% |
VeridiumID Server Performance Test Results
Registration test evidence
50 concurrent tasks · 2 web app nodes × 4 vCPU · 3 persistence nodes × 4 vCPU
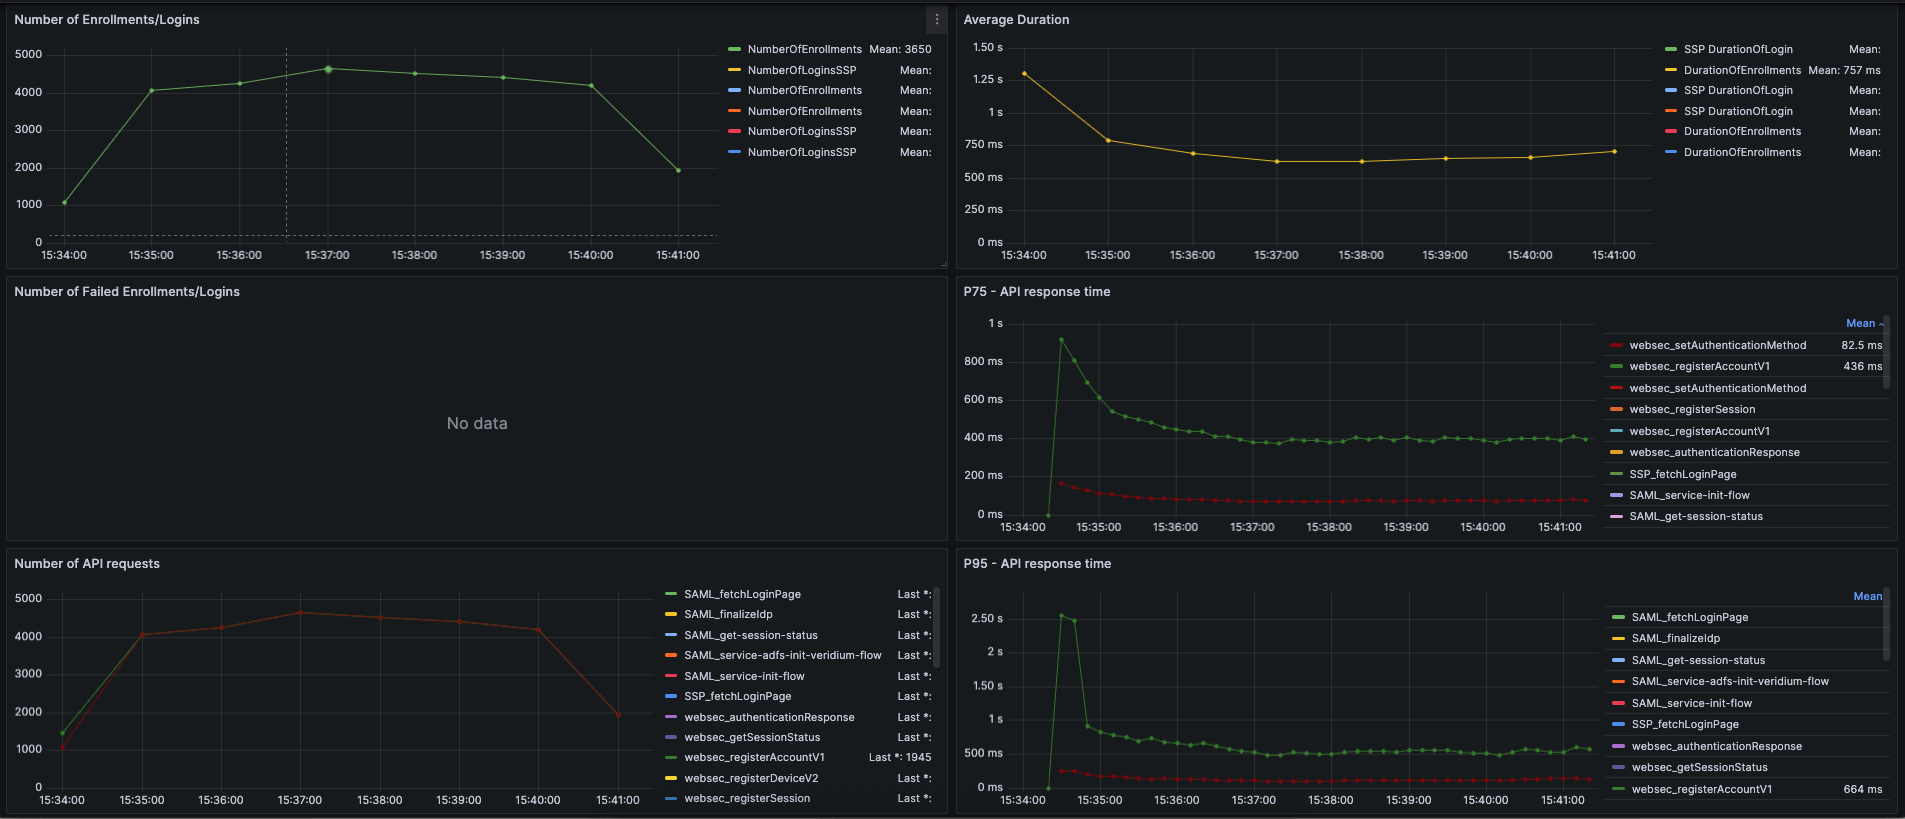
100 concurrent tasks · 2 web app nodes × 4 vCPU · 3 persistence nodes × 4 vCPU
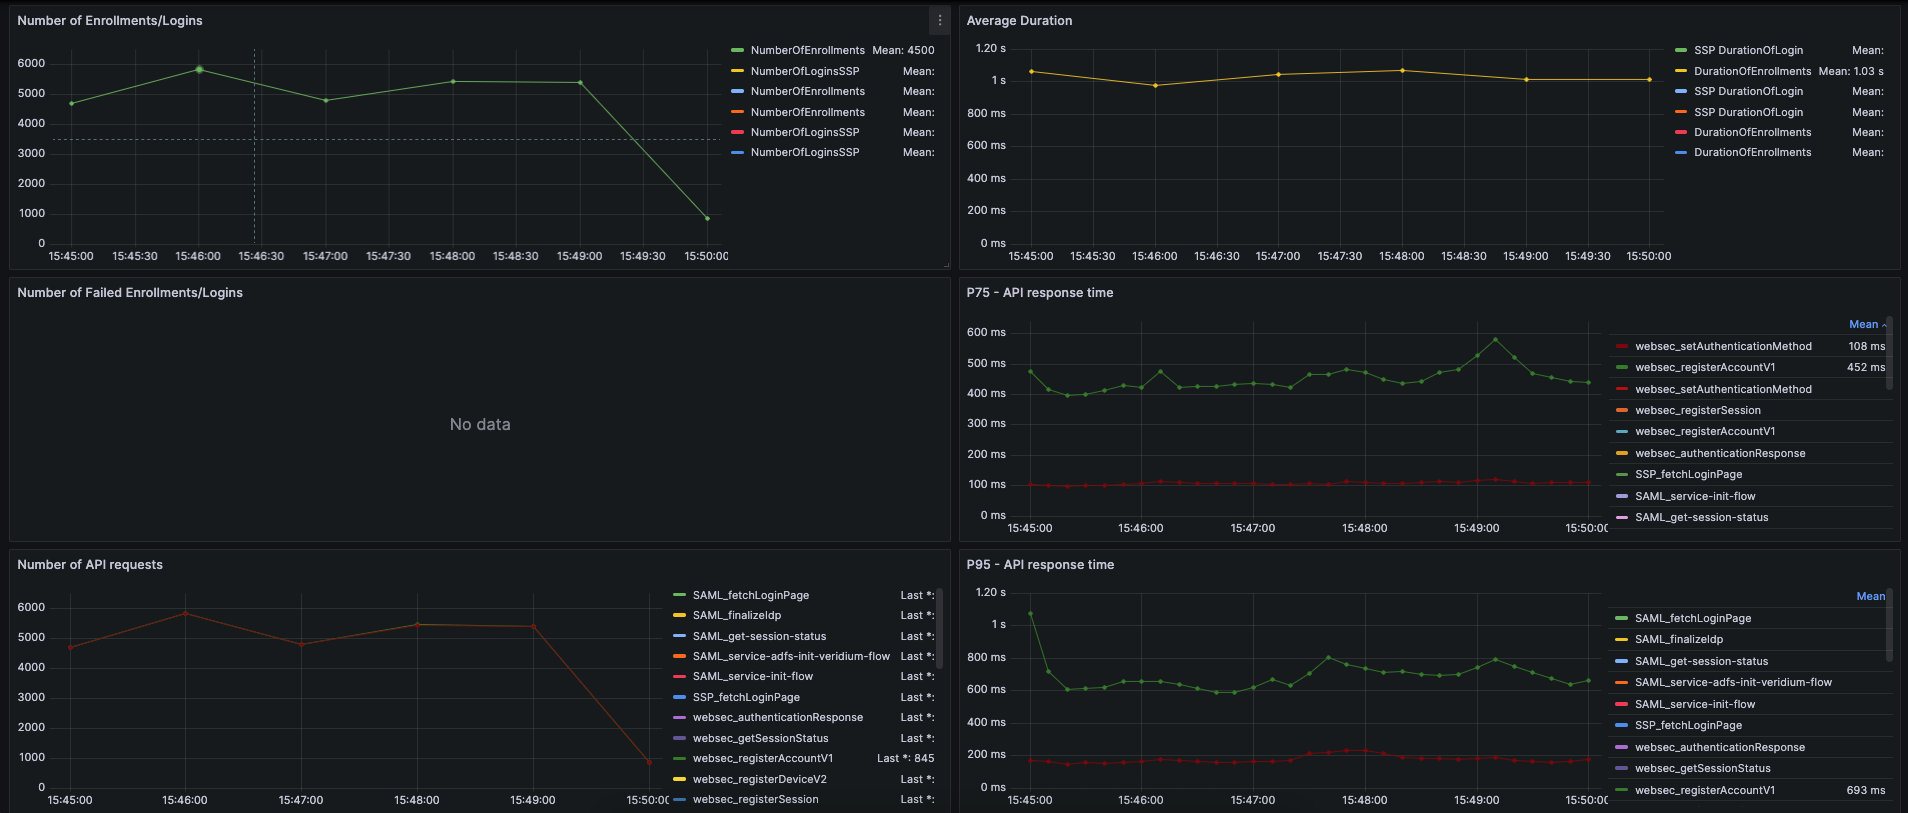
100 concurrent tasks · 2 web app nodes × 8 vCPU · 3 persistence nodes × 8 vCPU
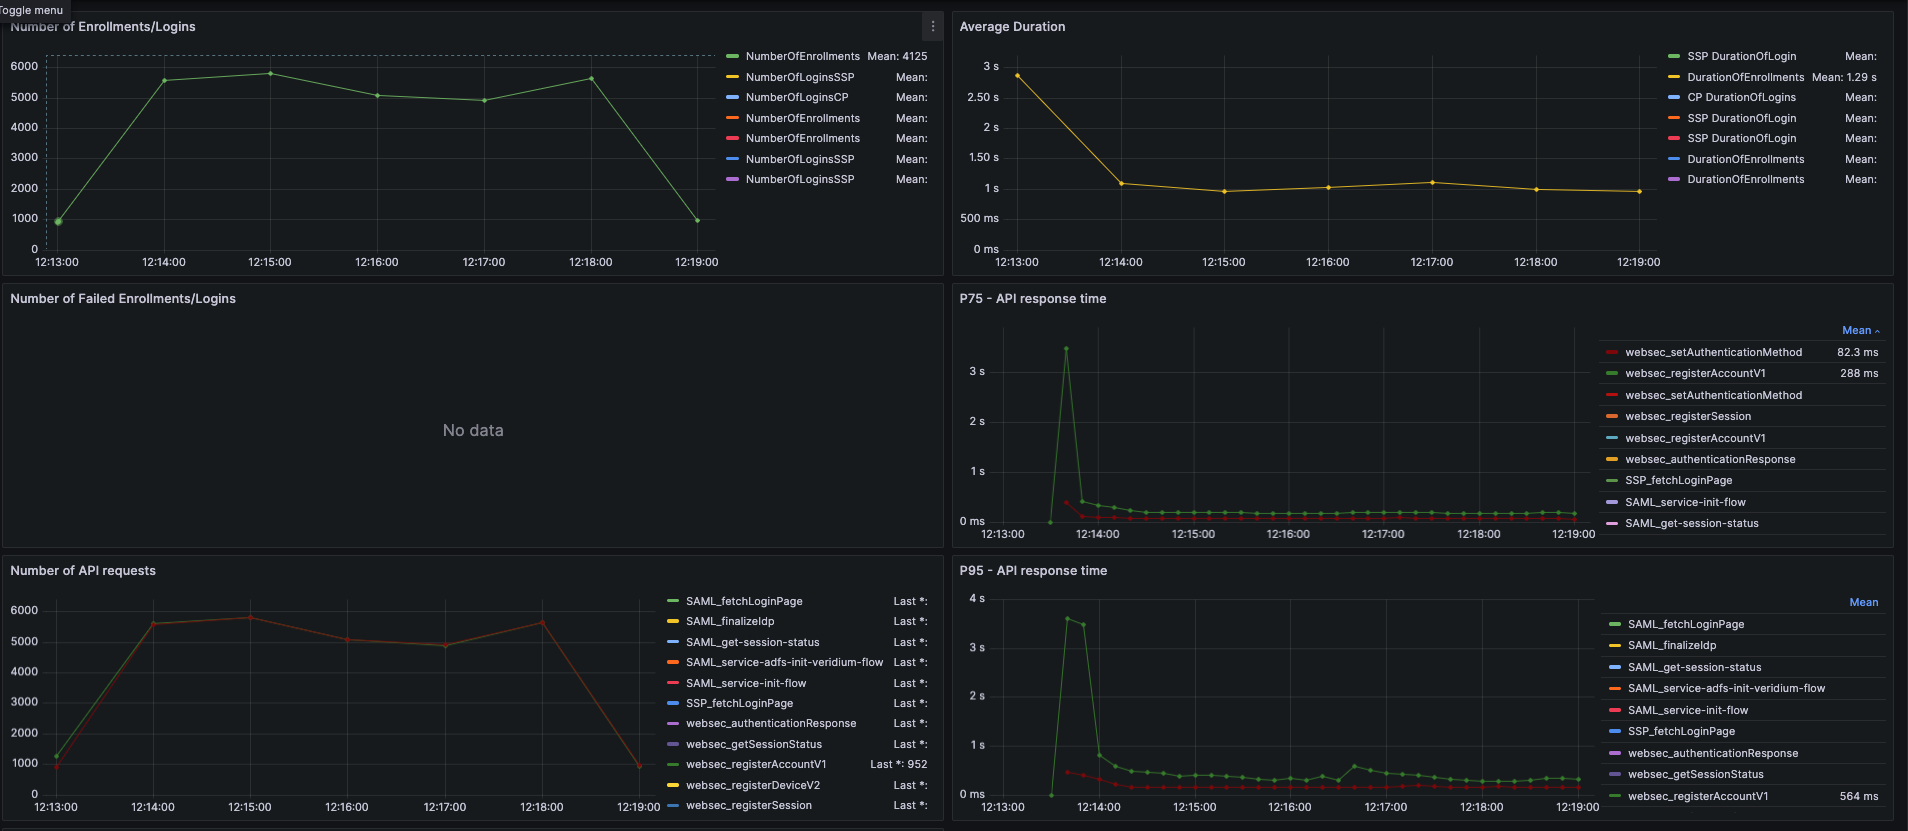
SAML login test evidence
50 concurrent tasks · 2 web app nodes × 4 vCPU · 3 persistence nodes × 4 vCPU
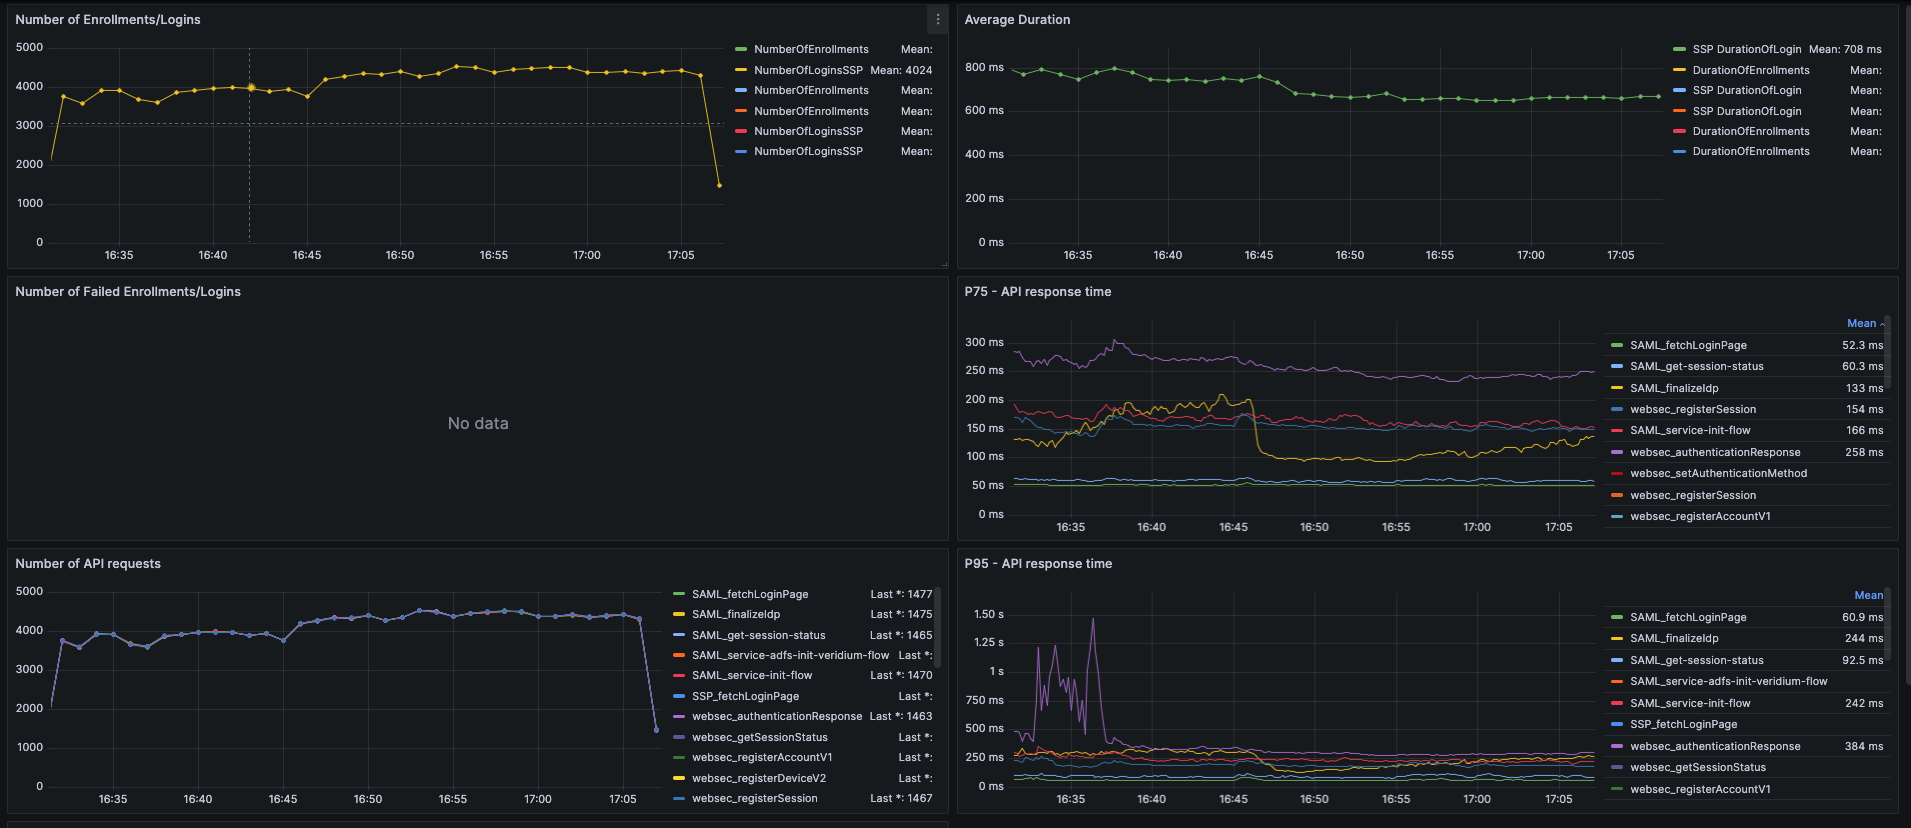
100 concurrent tasks · 2 web app nodes × 4 vCPU · 3 persistence nodes × 4 vCPU
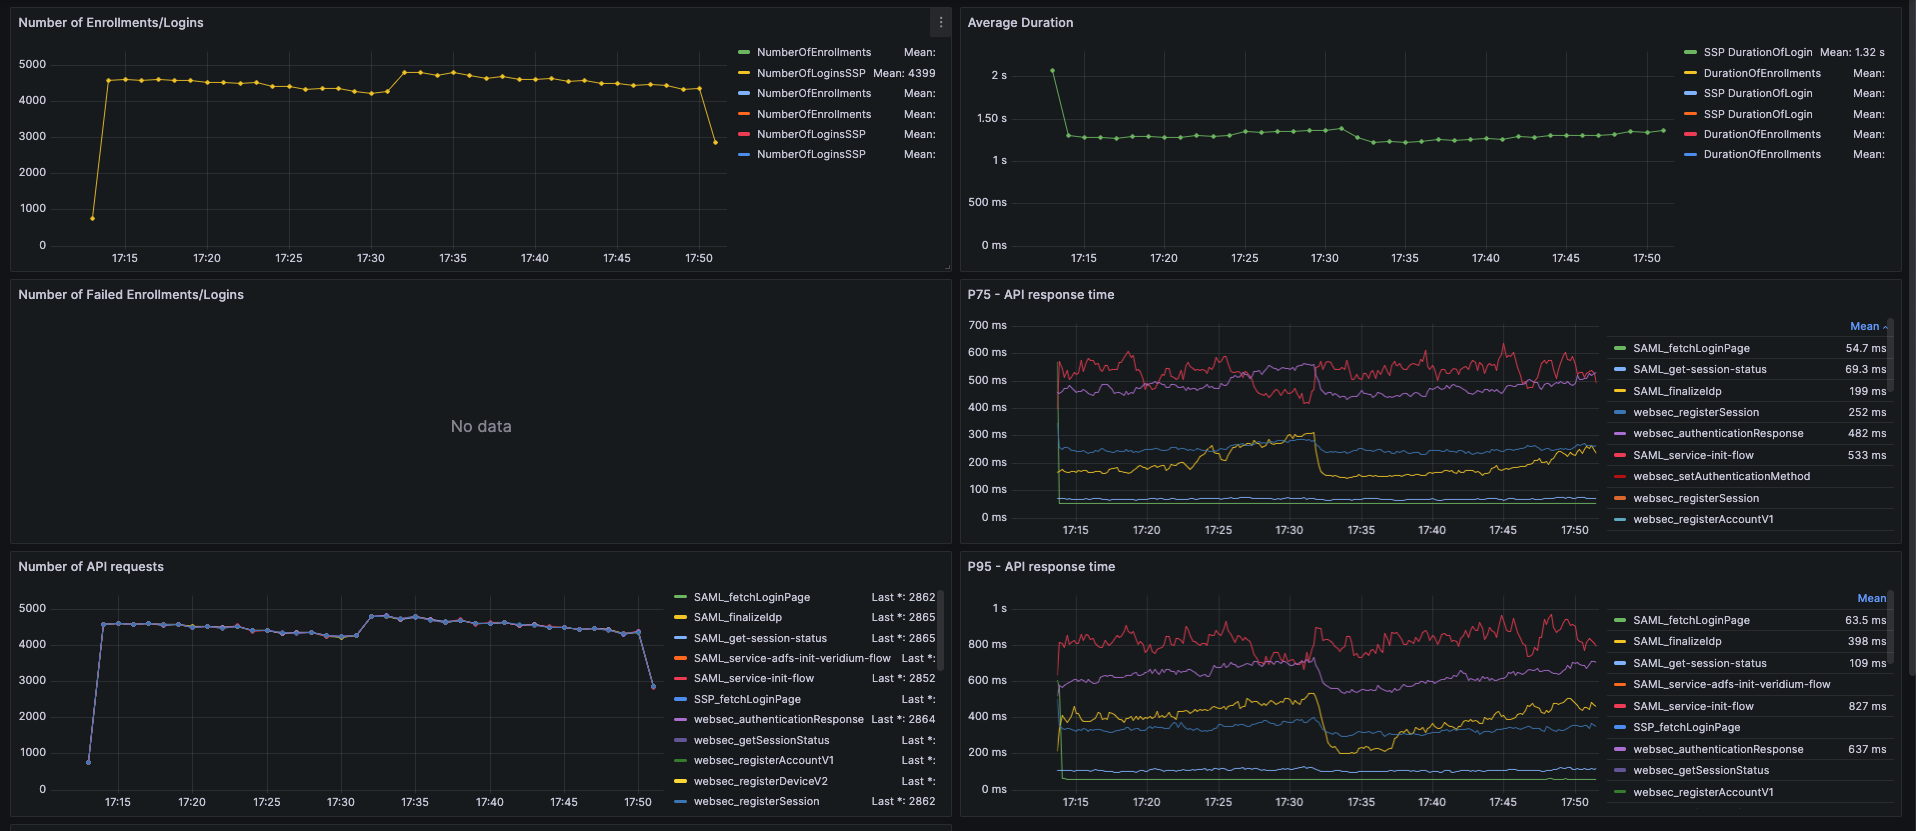
Windows Credential Provider test evidence
Device enrollment
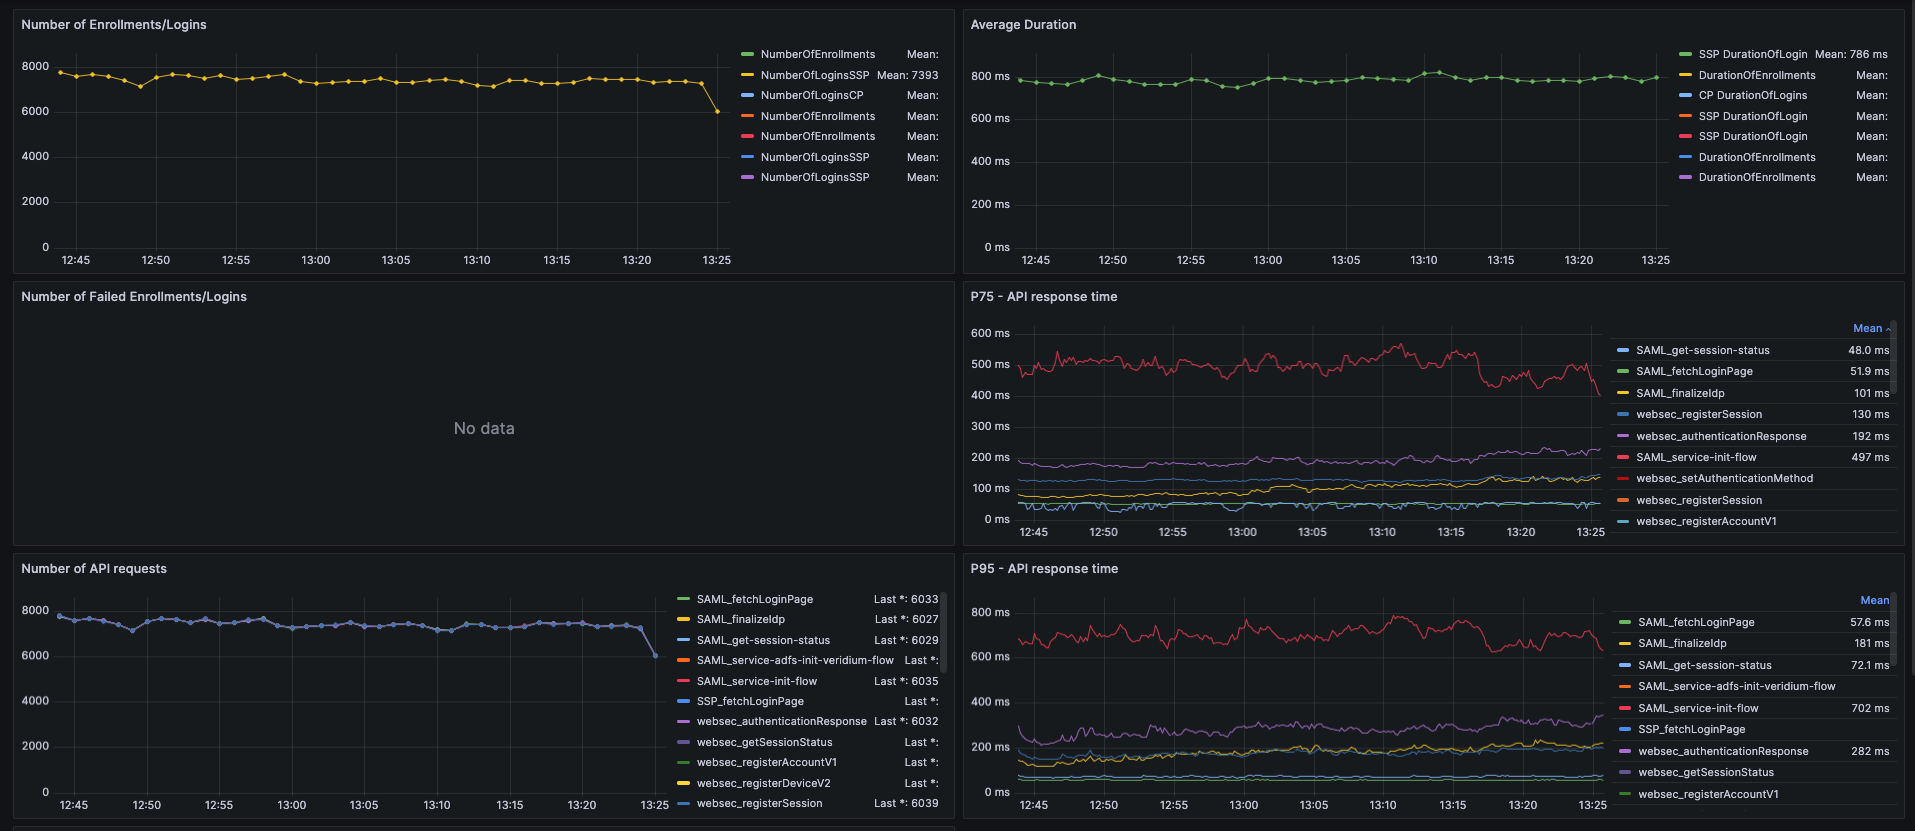
Login and certificate generation · certificate caching enabled once
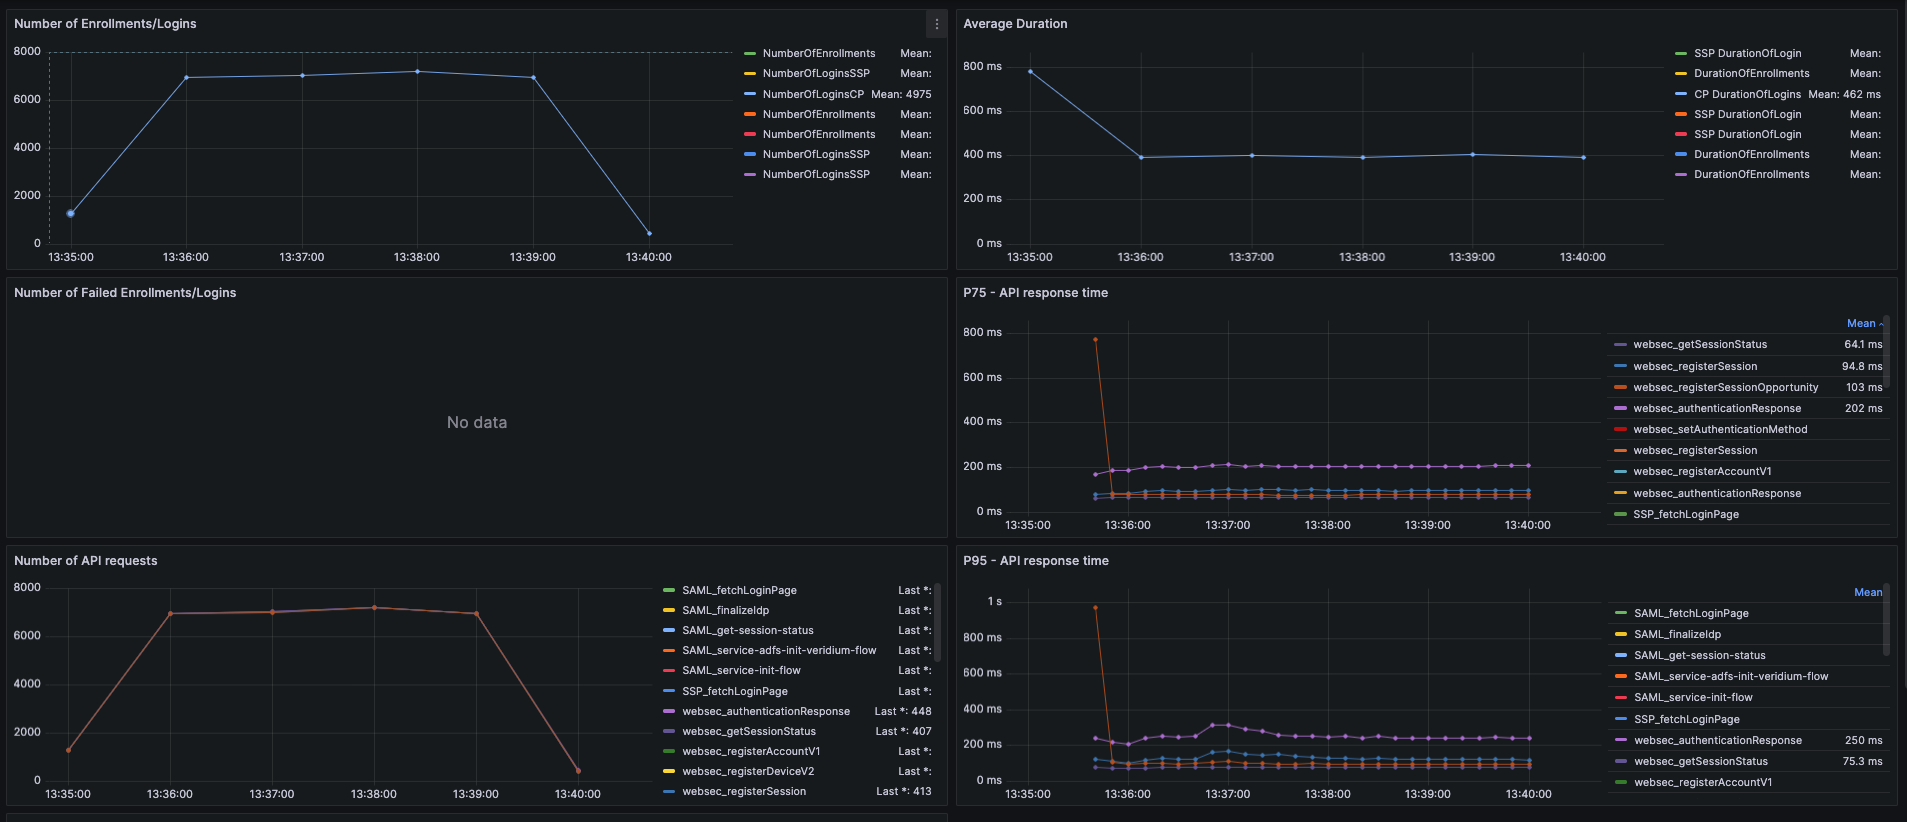
Login and certificate generation · certificate caching enabled for 60 minutes
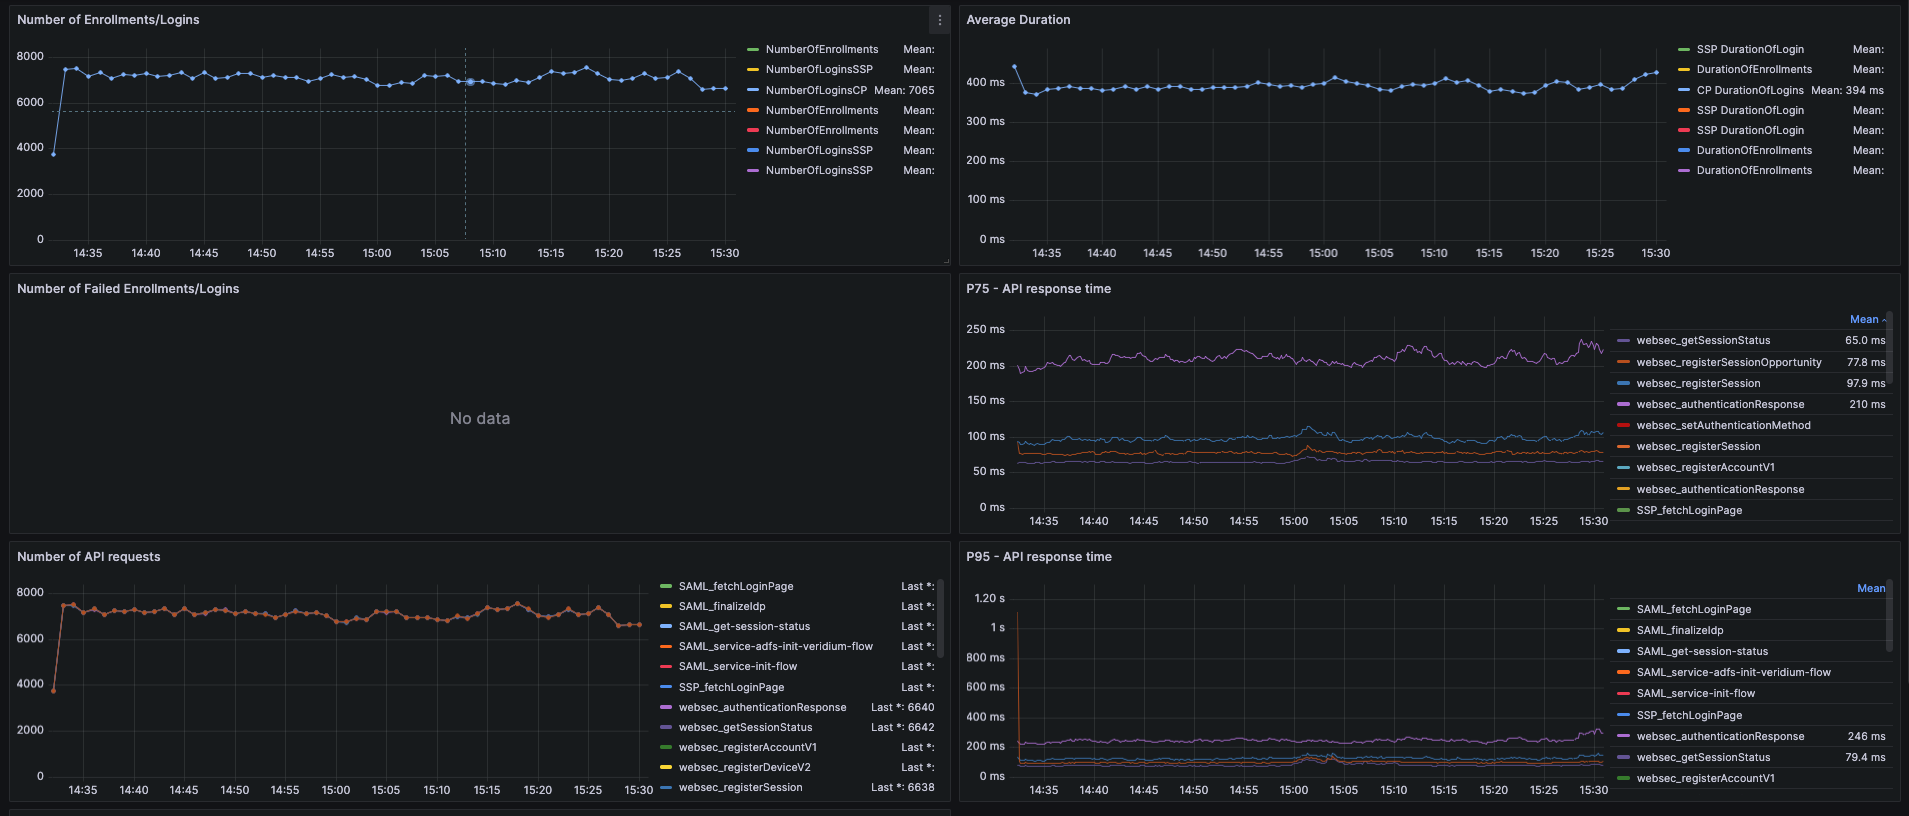
Notes
-
Throughput is reported as sessions per minute.
-
Concurrent-task duration is included where it was recorded in the source results.
-
Some CP login and certificate-generation measurements were not recorded in the source results.