Skip table of contents

Service Monitoring

Overview

Veridium Server provides a centralised mechanism for monitoring the status of the services.

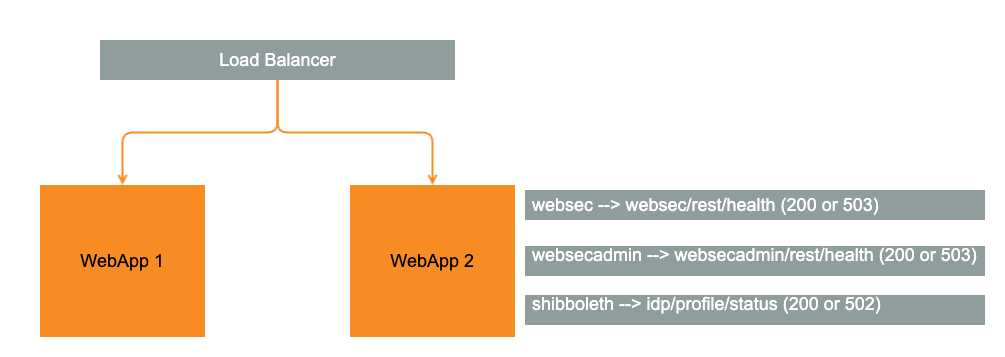
The picture bellow describes the Probes of services being subject of load balancing. Probes provides 200 HTTP response code in case of service being available. For other response code, the Load Balancer should skip communication to that node.

Oops, Diagram Unavailable

This diagram can't be displayed. It may have been moved or deleted, or the page's access settings may be preventing it from loading. Pages with restricted access must also include Gliffy Diagrams in their allowed list.

Monitoring in a centralised point have to aspects:

  • Monitoring of the Host machine

  • Monitoring of Application Layer

Oops, Diagram Unavailable

This diagram can't be displayed. It may have been moved or deleted, or the page's access settings may be preventing it from loading. Pages with restricted access must also include Gliffy Diagrams in their allowed list.

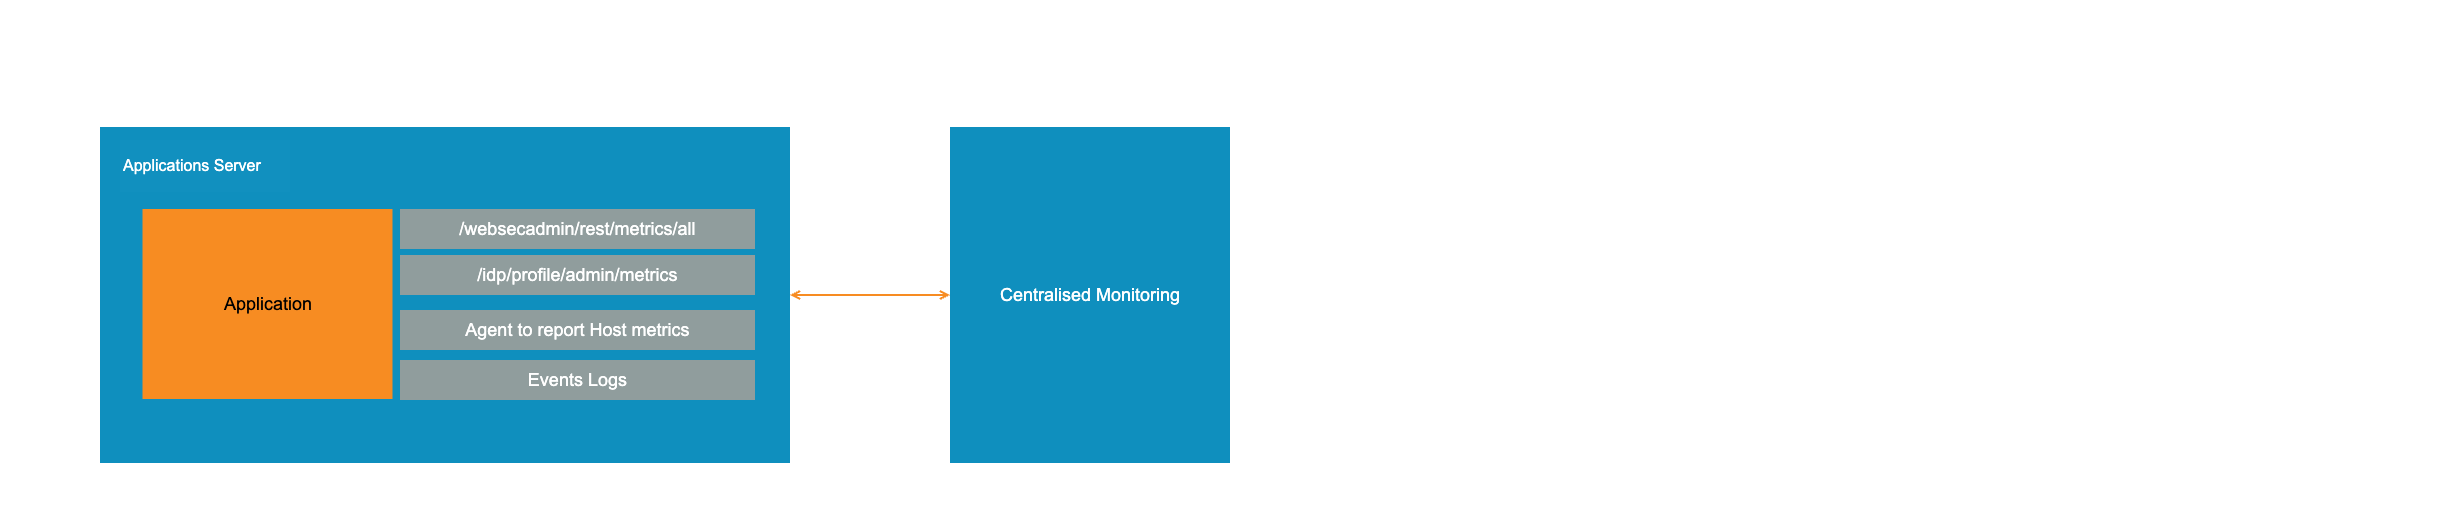
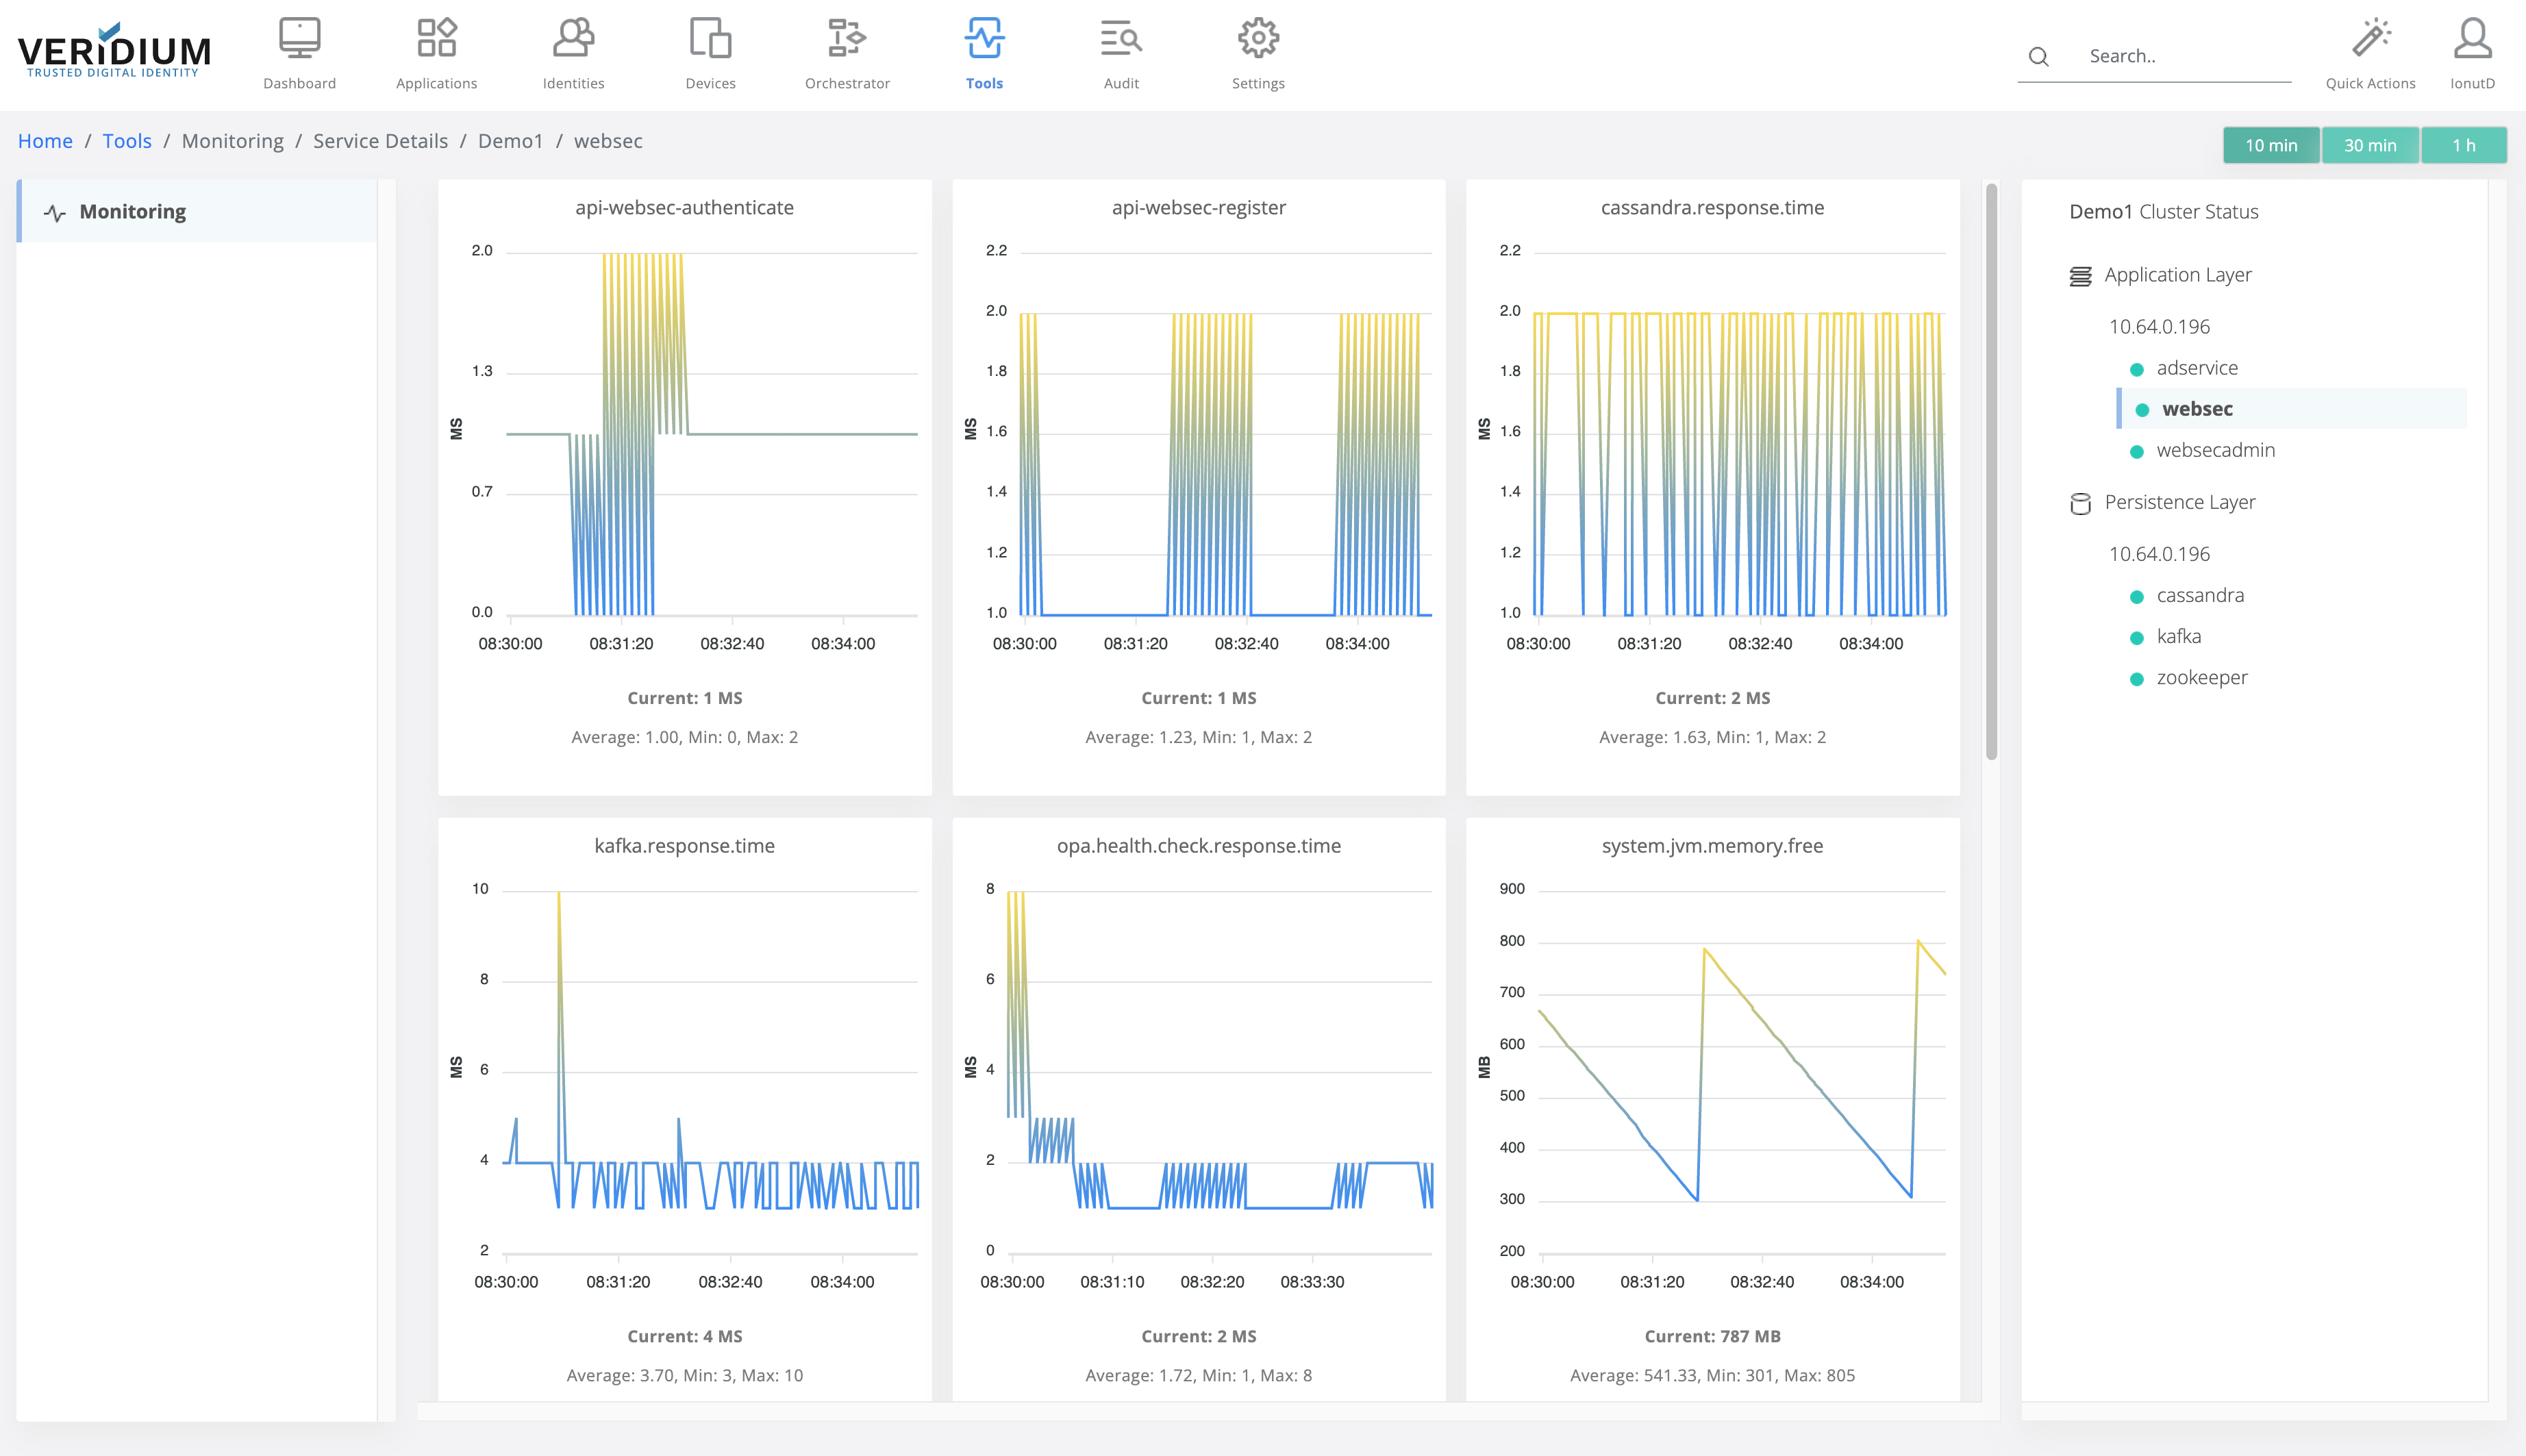
The restAPI /metrics/all will report back all the informations as it is visualised in Admin Dashboard \ Tools.

The metrics are subject of configuration (threshold) when the service it is reported as being not available.

JavaScript errors detected

Please note, these errors can depend on your browser setup.

If this problem persists, please contact our support.