
-
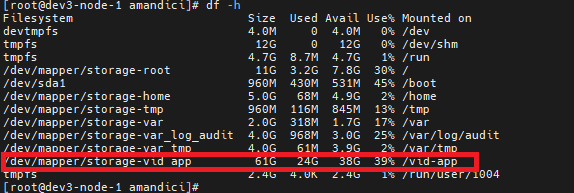
Check disk space on Linux services and identify any usage over 75%.
## check the total disk usage; Veridium writes information mainly in /vid-app.
df -h
## check size of a specific folder
du -sk /vid-app | sort -n
-
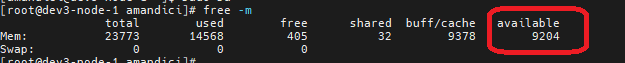
Check if there is sufficent available memory (there should be 1,2 Gb available memory. Available memory includes also the free part). It is higly recommended to disable swap. So in below picture swap is 0.
free -m
-
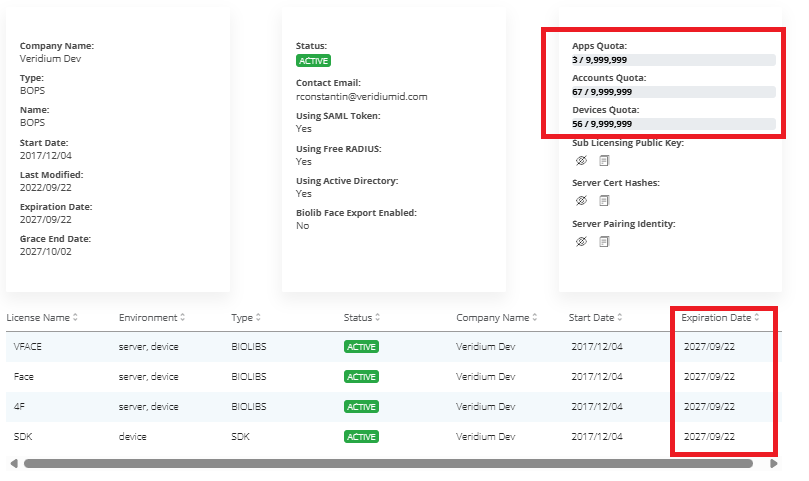
Check license expiration date, number of accounts, and device limits in websecadmin → Settings → License.
-
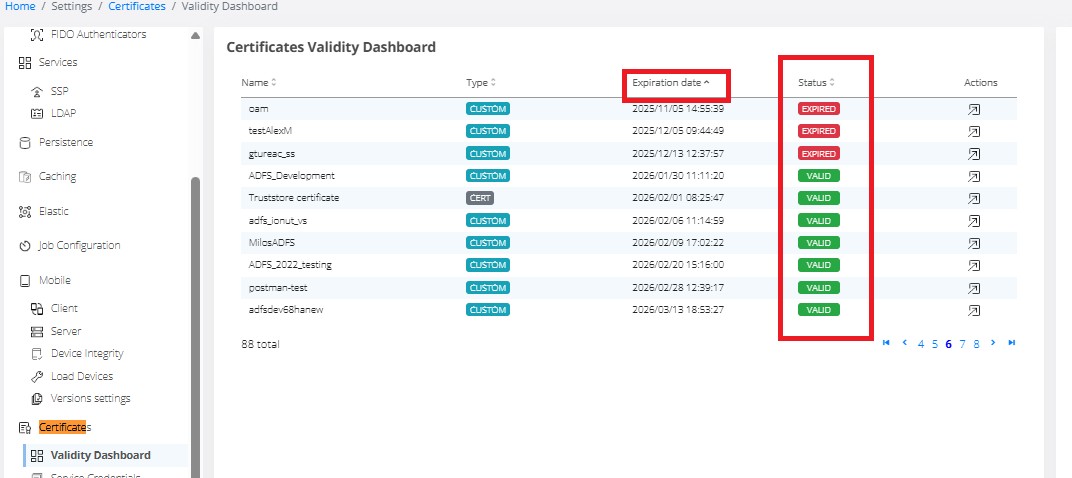
Check certificate expiration in Websecadmin → Certificates → Validity Dashboard. Sort certificates by expiration date.
-
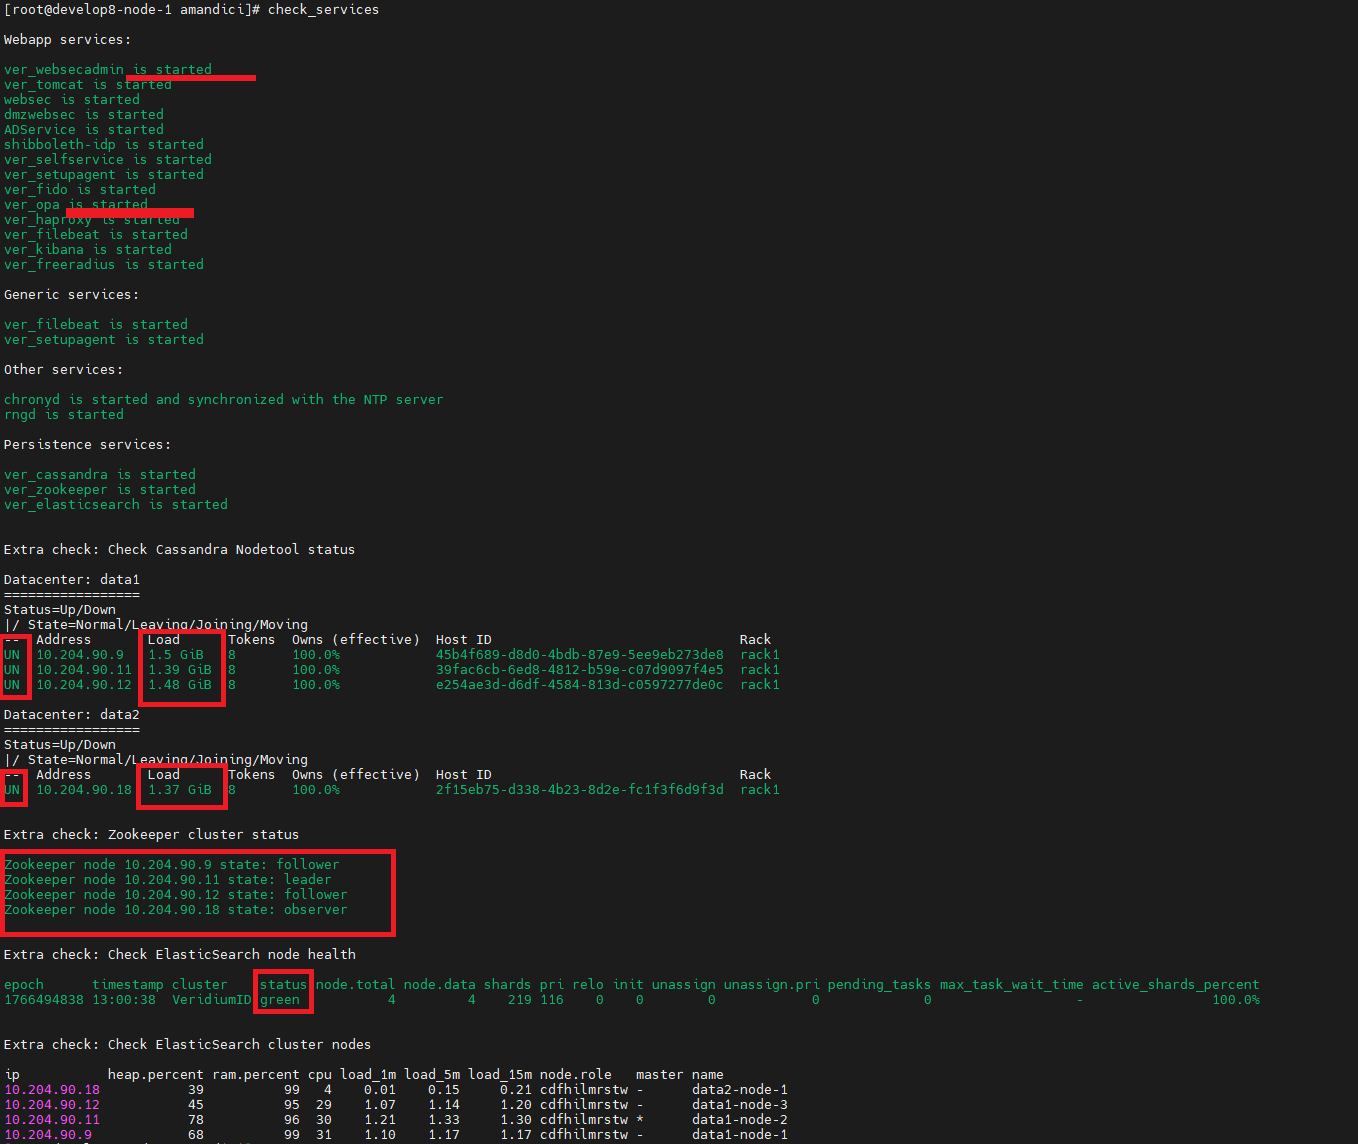
Periodically monitor check_services scripts. Consider creating a script to parse output and send alerts if issues arise.
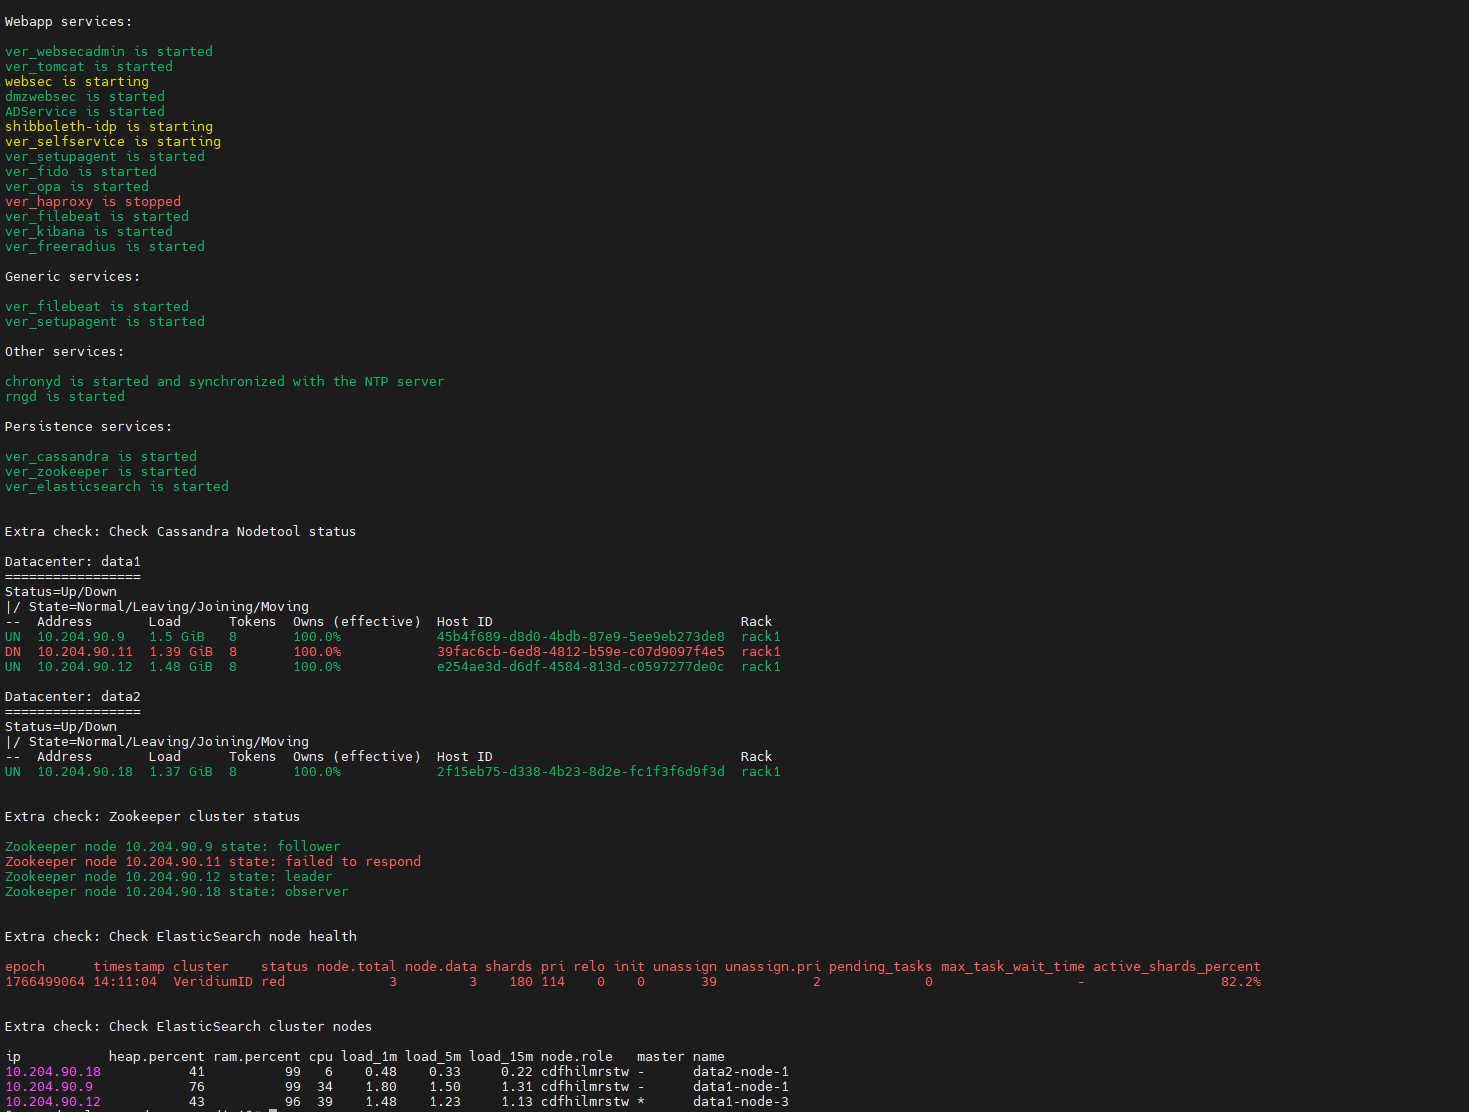
See an example with issues:
-
some services are in starting mode or are stopped.
-
one cassandra node is down.
-
one zookeeper node is down or did not respond.
-
elasticsearch cluster is in status red. Also it should have 4 nodes in the cluster, but it hase only 3.
-
Ensure all services are started. No service should be in 'stopped' or 'starting' status.
-
Cassandra
-
All nodes should have status UN - Up Normal. Other statuses indicate issues.
-
Node load should remain stable over time. Monitor periodically to ensure database size varies minimally (under 100 MB daily).
-
If increases occur, run these commands before opening a ticket to identify large nodes and table sizes.
##
nodetool status
##
du -sk /opt/veridiumid/cassandra/data/*/* | sort -n
-
-
Zookeeper
-
Zookeeper cluster should have one leader.
-
All nodes should be responsive.
-
-
Elasticsearch
-
Elasticsearch status should be green with 100% active shards.
-
-
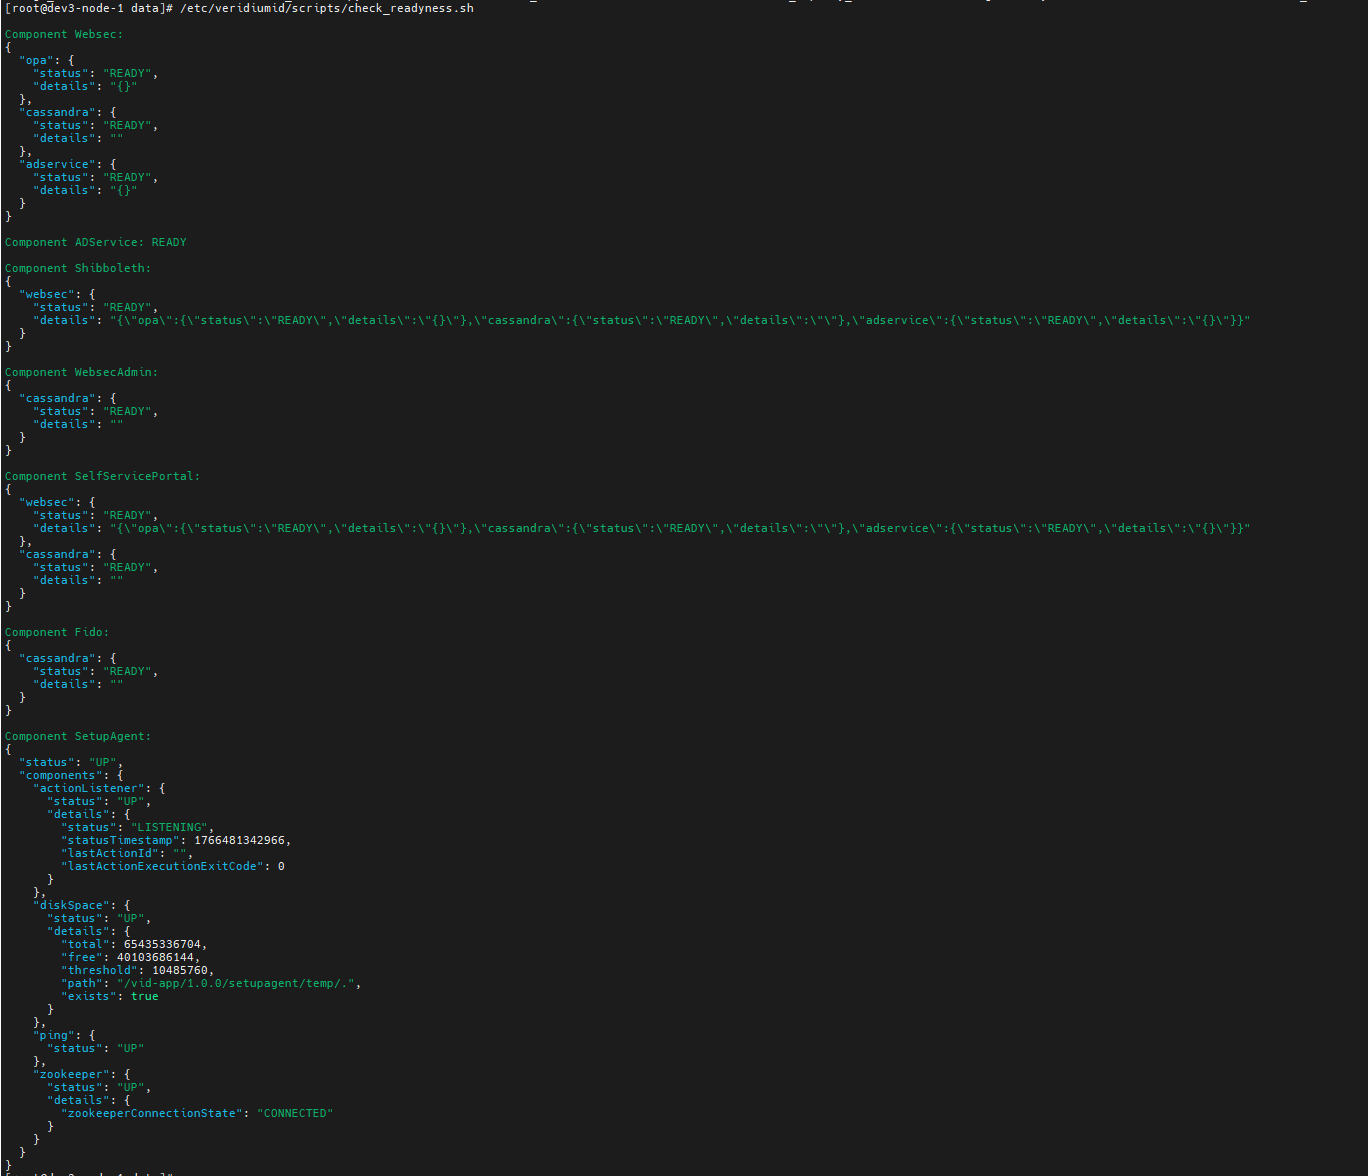
Run script /etc/veridiumid/scripts/check_readyness.sh to verify all components are running. Useful for troubleshooting and monitoring.
-
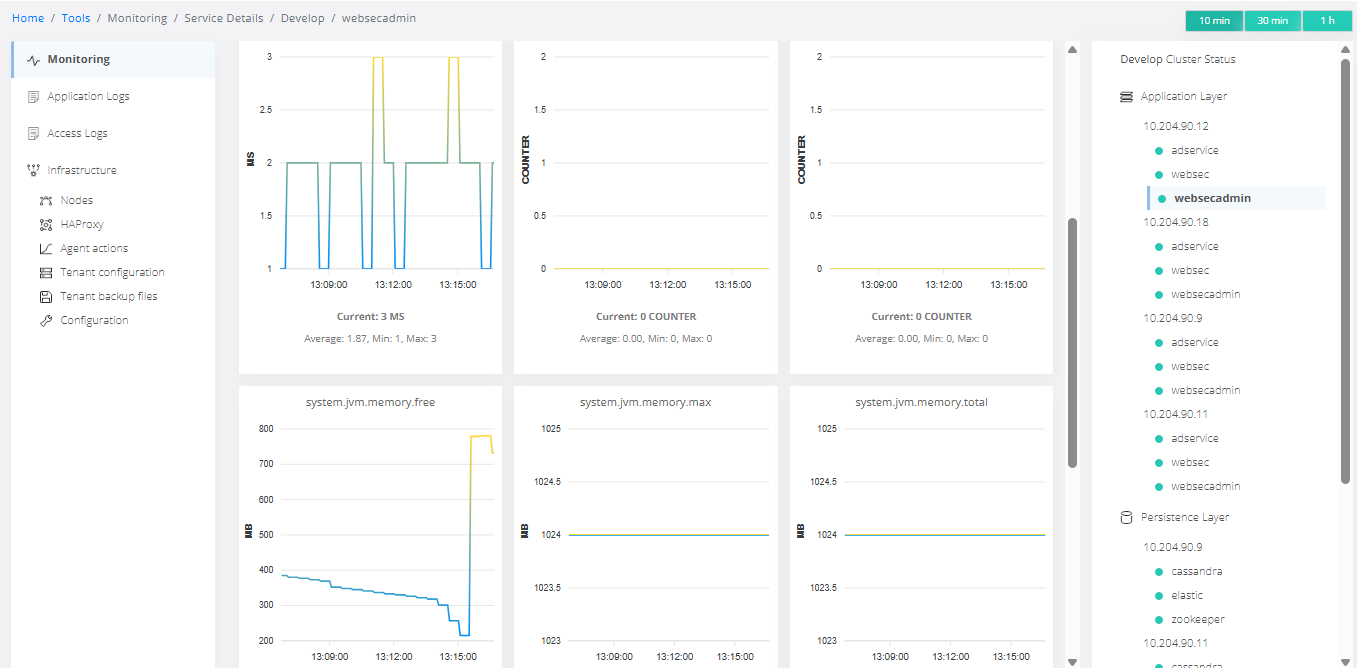
Review metrics in websecadmin
-
Tools → monitoring - ensure all indicators are green.
-
Tools → monitoring → websecadmin → accounts.commit.log.size, devices.commit.log.size, profiles.commit.log.size, sessions.commit.log.size should be 0 or fluctuate, then decrease. If not, open a ticket with Veridium.
-
-
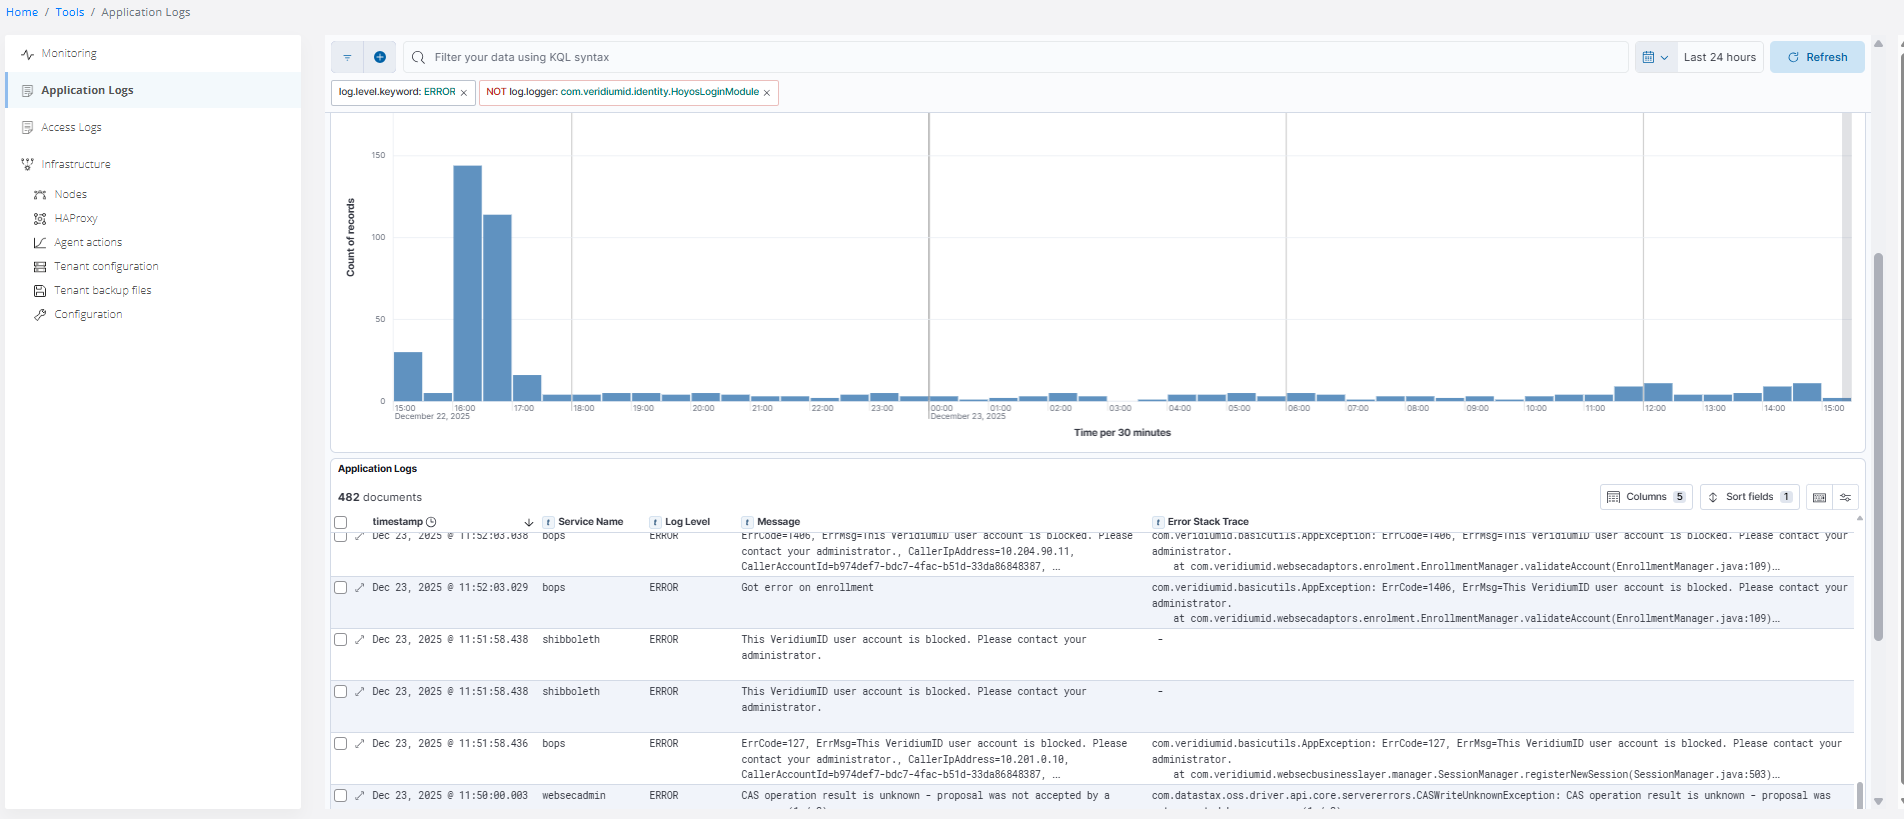
Regularly review errors to detect new issues:
Below is an example of setting different filters.
-
Check maintenance logs to ensure no errors in backup, restore, or compact procedures. Currently, these logs are not in Elasticsearch. Also, verify backups run periodically.
#### cassandra - persistence
grep ERROR /var/log/veridiumid/cassandra/backup.log
grep ERROR /var/log/veridiumid/cassandra/maintenance.log

## verify backup existence: folder with YYYY-MM-DD_HH24-MI - backup date.
ls -lrt /opt/veridiumid/backup/cassandra/

#### elasticsearch - persistence
grep ERROR /var/log/veridiumid/elasticsearch/backup.log

## check last successful backup date - should be yesterday. Executed on one persistence node.
cat /opt/veridiumid/backup/elasticsearch/data/last_backup.txt

#### zookeeper - webapps - verify backup per crontab - recent date expected.
grep ERROR /var/log/veridiumid/ops/zookeeper_backup.log
##
ls -lrt /opt/veridiumid/backup/zookeeper/

#### config files backup - all nodes
grep ERROR /var/log/veridiumid/ops/backup_configs.log
## verify recent backup of files
ls -lrt /opt/veridiumid/backup/all_configs/