
Overview
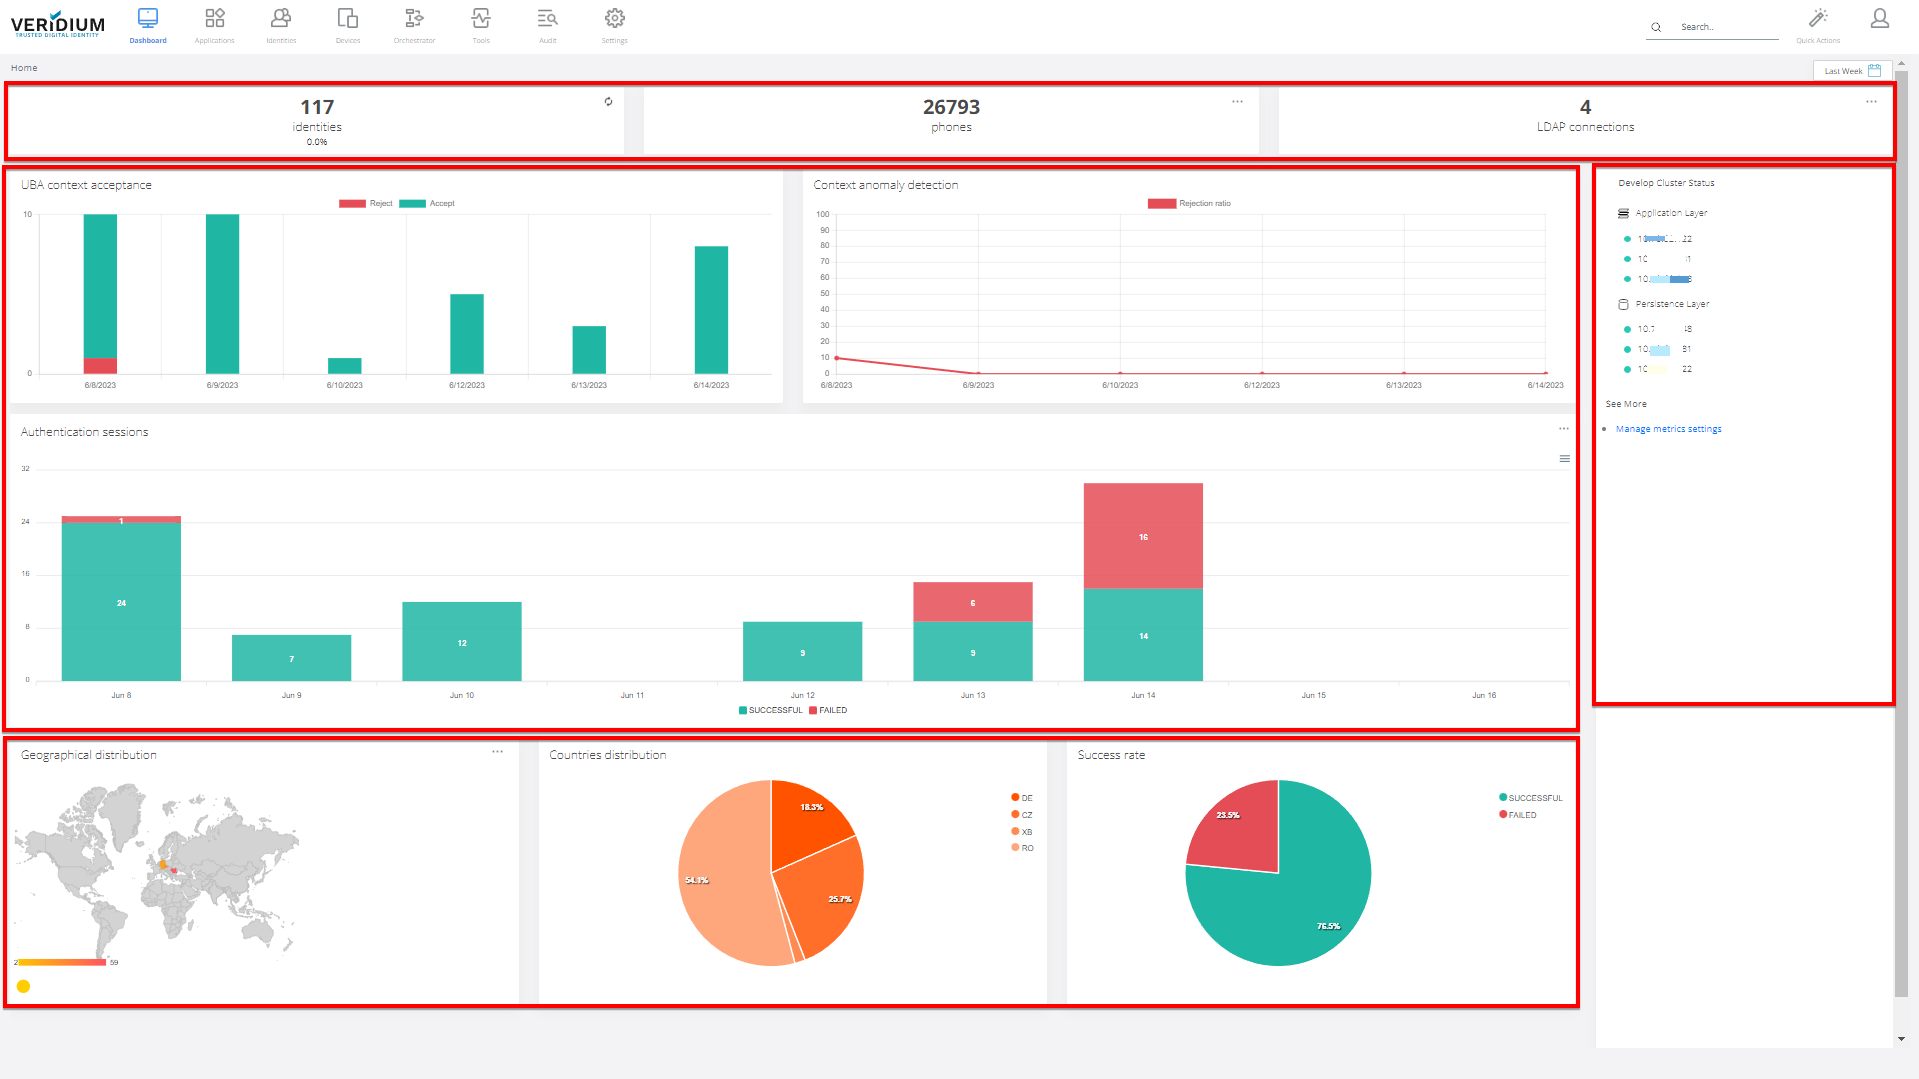
Dashboard shows quick overview information about the system.
First part are statistical information:
-
number of onboarded users
-
number of onboarded phones
-
number of LDAP connections
Next part shows several charts giving quick overview about operational and security status statistics for last month:
UBA related:
-
UBA (User Behavior Acceptance) showing ratio about accepted/refused session based on UBA criteria.
Authentication sessions statistics:
-
Number of authentication sessions
-
Geographical distribution of the requests (in map and per country)
-
Authentication success rate
These values are important to see current status, historical overview data and also helps to predict trends.
In the bottom part charts for Geographical distribution, Countries distribution and Success rate are displayed.
On the right part of the page, information about Cluster Status can be observed.