

WebsecAdmin interface:
Elasticsearch Management
Overview
The Elasticsearch Management page provides administrators with a centralized interface for monitoring the health of the Elasticsearch cluster and performing common index management operations. It offers real-time visibility into cluster status, node utilization, shard allocation, and index health, while also providing maintenance actions to keep the cluster healthy and performant.
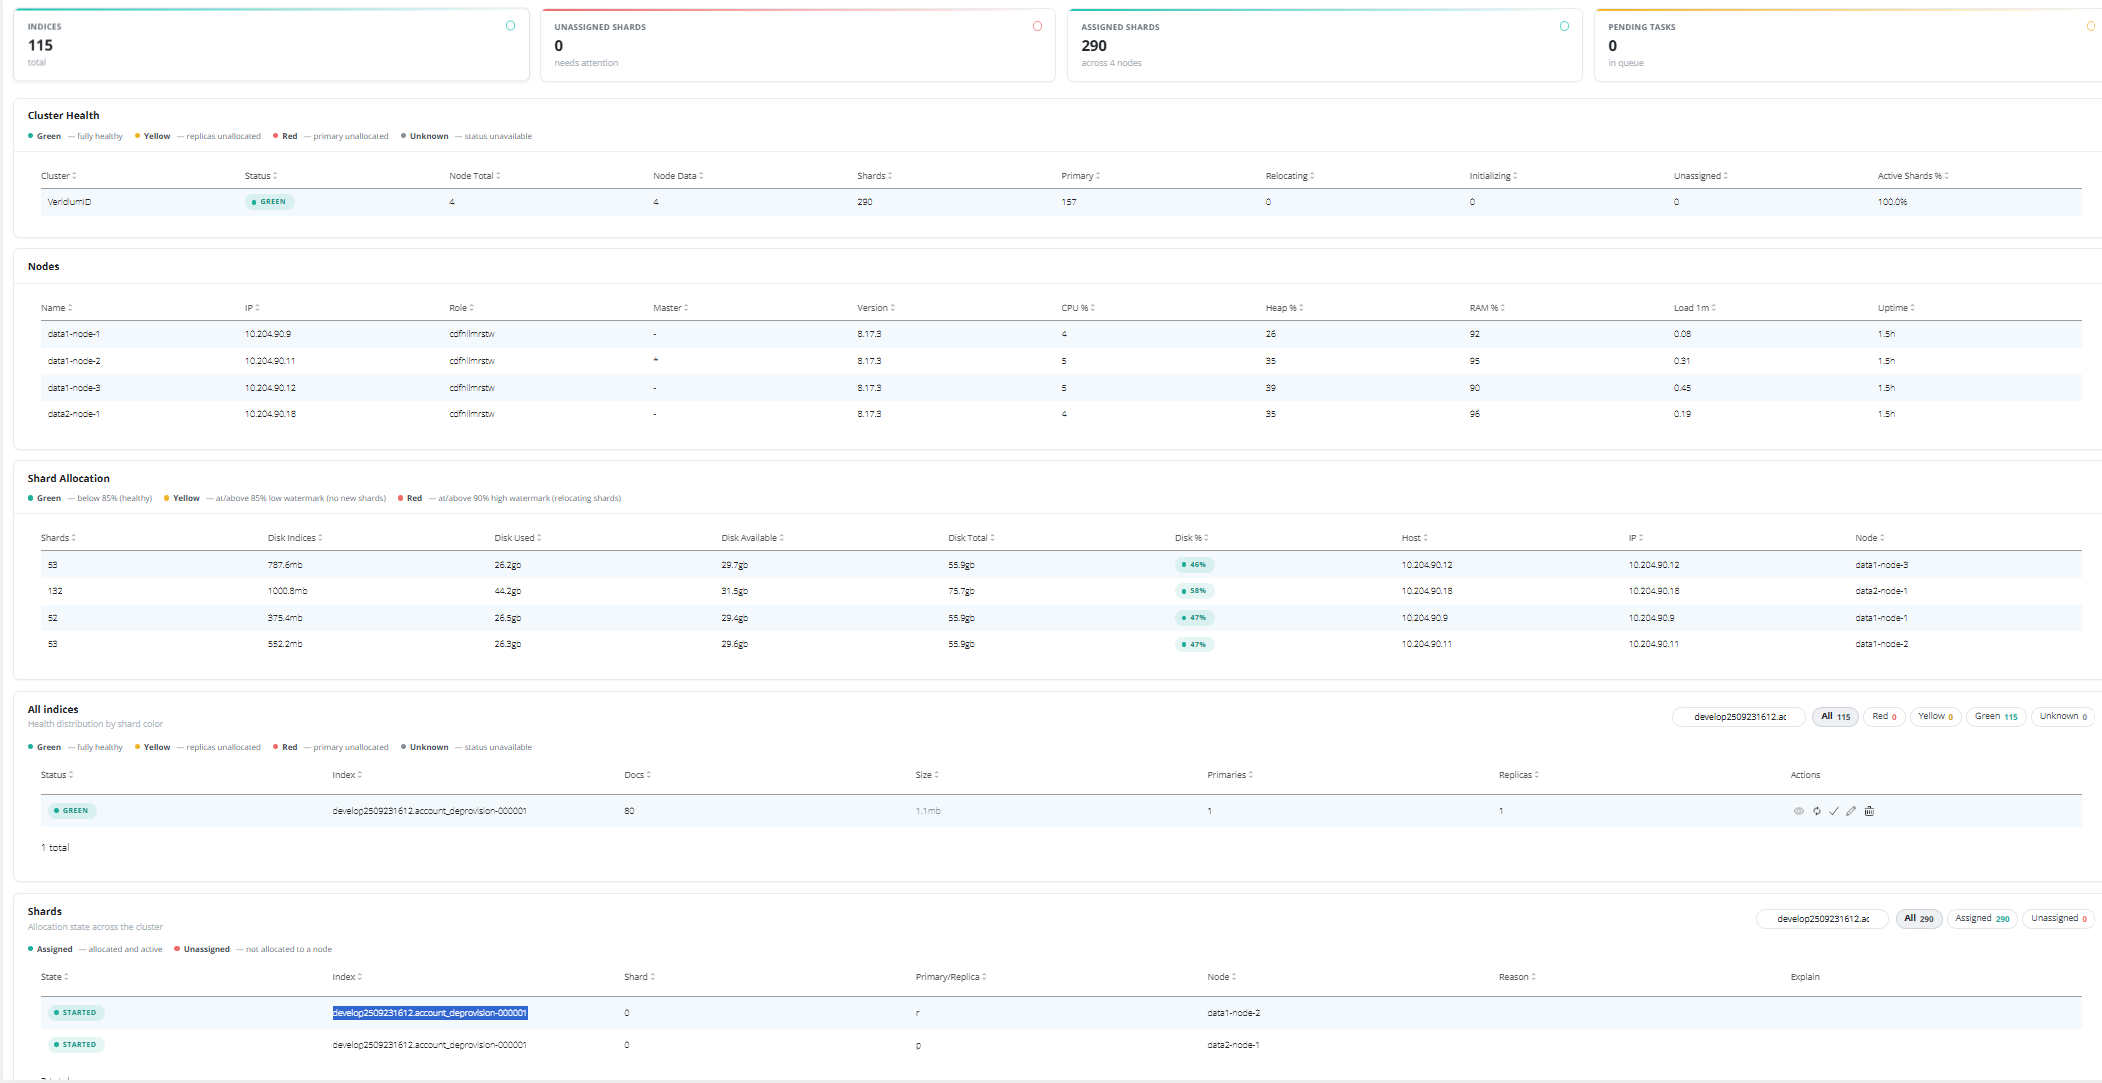
Dashboard Sections
1. Cluster Summary
The summary section at the top of the page provides a quick overview of the Elasticsearch cluster.
It includes:
-
Total Indices – Number of indices currently available in the cluster.
-
Unassigned Shards – Number of shards that are not allocated to any node (requires attention if greater than zero).
-
Assigned Shards – Total number of shards currently allocated across the cluster.
-
Pending Tasks – Number of cluster tasks waiting to be executed.
These metrics provide an immediate indication of the cluster's overall health.
2. Cluster Health
The Cluster Health section displays the current status of the Elasticsearch cluster.
Displayed information includes:
-
Cluster name
-
Cluster health status
-
Green – All primary and replica shards are allocated.
-
Yellow – All primary shards are allocated, but one or more replica shards are not.
-
Red – One or more primary shards are unavailable.
-
Unknown – Cluster status cannot be determined.
-
-
Total nodes
-
Data nodes
-
Total shards
-
Primary shards
-
Relocating shards
-
Initializing shards
-
Unassigned shards
-
Percentage of active shards
This section helps administrators quickly determine whether the cluster is operating normally.
3. Cluster Nodes
The Nodes section lists every node currently participating in the Elasticsearch cluster.
For each node, the following information is displayed:
-
Node name
-
IP address
-
Node role
-
Master node indicator
-
Elasticsearch version
-
CPU utilization
-
Heap memory usage
-
RAM utilization
-
System load
-
Node uptime
This information is useful for monitoring resource consumption and identifying overloaded or unhealthy nodes.
4. Shard Allocation
The Shard Allocation section shows how shards are distributed across the cluster nodes.
For each node, the following metrics are available:
-
Number of shards hosted
-
Number of indices
-
Disk space used
-
Available disk space
-
Total disk capacity
-
Disk utilization percentage
-
Host name
-
IP address
-
Node name
This view helps ensure that shards are evenly distributed and that sufficient disk space remains available on each node.
5. Index Management
The All Indices section displays every index in the cluster along with its current status.
For each index, the page displays:
-
Health status
-
Index name
-
Document count
-
Index size
-
Number of primary shards
-
Number of replica shards
Available Actions
Each index can be managed directly from this page.
Reindex
Recreates an index by copying its data into a newly created index.
This operation is typically performed after:
-
Updating an index template
-
Changing mappings
-
Applying new index settings
Reindexing ensures that existing documents are recreated using the latest template configuration.
Flush
Flush forces Elasticsearch to write in-memory operations to disk.
This operation:
-
Commits pending changes
-
Frees transaction log space
-
Improves data durability
Normally Elasticsearch performs flush operations automatically, but administrators may trigger it manually when needed.
Change Replicas
Allows administrators to modify the number of replica shards for an index.
Increasing replicas:
-
Improves search performance
-
Increases fault tolerance
Decreasing replicas:
-
Reduces storage usage
-
May improve indexing performance
Changes are applied dynamically without recreating the index.
Delete Index
Deletes the selected index and all stored data.
Warning: This operation is irreversible. All documents contained within the index will be permanently removed.
6. Shard Details
The Shards section provides detailed information about every shard within the cluster.
Information includes:
-
Allocation status
-
Index name
-
Shard ID
-
Primary or replica designation
-
Assigned node
-
Allocation reason (when applicable)
-
Allocation explanation
This section is particularly useful when diagnosing allocation problems or investigating why shards are not assigned correctly.
7. Pending Tasks
The Pending Tasks section displays cluster operations that are waiting to be executed.
Examples include:
-
Shard allocation
-
Cluster state updates
-
Recovery operations
-
Metadata updates
Under normal conditions, this section should be empty. A growing list of pending tasks may indicate cluster performance issues or resource constraints.
Typical Administrative Workflow
Administrators typically use this page to:
-
Verify overall cluster health.
-
Monitor node CPU, memory, and disk utilization.
-
Review shard distribution across nodes.
-
Identify unhealthy indices.
-
Perform maintenance operations such as:
-
Reindexing after template updates
-
Flushing indices
-
Adjusting replica counts
-
Deleting obsolete indices
-
-
Investigate shard allocation issues.
-
Monitor pending cluster tasks for potential operational problems.
Best Practices
-
Maintain a Green cluster health status whenever possible.
-
Monitor disk utilization and avoid nodes exceeding 80–85% disk usage.
-
Review unassigned shards immediately, as they may impact cluster resilience.
-
Reindex indices after significant mapping or template changes.
-
Adjust replica counts based on availability and performance requirements.
-
Delete obsolete indices to reclaim storage and improve cluster performance.
-
Regularly monitor pending tasks to detect bottlenecks before they affect cluster operations.
This interface provides administrators with a single, comprehensive view of Elasticsearch cluster health while offering the most common operational and maintenance functions required to manage indices and ensure cluster stability.
Linux commands:
-
check status by running command:
bash /etc/veridiumid/scripts/check_services.sh

Status explained:
-
Cluster status → yellow
-
unassing indices → 10
-
active_shards_percent → 96.8%
-
in case of issues, for example cluster is yellow or red, run below command, to see what are the problems:
/opt/veridiumid/elasticsearch/bin/elasticsearch_ops.sh -t
This command extracts:
## cluster status
eops -x=GET -p=/_cat/health?v

## see all nodes; each column should be clear what it means; also present allocation
eops -x=GET -p=/_cat/nodes?v\&s=name&h=name,ip,node.role,master,version,cpu,heap.percent,ram.percentload_1m,uptime
eops -x=GET -p=/_cat/allocation?v

##all indices (not only veridium, but also system and see the status). Indices should be grouped by color (red, yellow, green)
eops -x=GET -p=/_cat/indices/?v | grep -v green

##overall shards allocation: group them in 2 parts - based by reason.
eops -x=GET -p=/_cat/shards?v\&h=index,shard,prirep,state,node,unassigned.reason | grep -v STARTED

## if there are unasigned, run this (this is generic)
eops -x=GET -p=/_cluster/allocation/explain | jq -r '["index","shard","primary","current_state","can_allocate","node","decision","explanation"],[.index,.shard,.primary,.current_state,.can_allocate,(.current_node.name // "N/A"),(.node_allocation_decisions[0].deciders[0].decision),(.node_allocation_decisions[0].deciders[0].explanation)]| @tsv' | column -t

## also show pending tasks
eops -x=GET -p=/_cluster/pending_tasks
Procedure - If one datacenter is lost, elasticsearch might be unavailable in remaing datacenter. Below is the procedure, how to remove on datacenter from CDCR.
1. stop elasticsearch nodes:
systemctl stop ver_elasticsearch

2. Remove the state on all nodes:
rm -rf /opt/veridiumid/elasticsearch/data/_state

3. set information about the cluster master nodes, accordingly
vi /opt/veridiumid/elasticsearch/config/elasticsearch.yml
cluster.initial_master_nodes: [ "dc1-node1", "dc1-node2", "dc1-node3" ]

4. start the cluster on these 3 nodes

5. create API key and update websecadmin -> elasticsearch.json:
eops -x=GET -p=/_security/api_key
eops -x=PUT -p=/_security/api_key -d='{"name":"veridium"}'

6. in second datacenter, when restored, please ensure that initial master nodes are commented and seeds are all 6.
also delete content:
systemctl stop ver_elasticsearch
rm -rf /opt/veridiumid/elasticsearch/data
and start services:
systemctl start ver_elasticsearch
Procedure - If one datacenter is lost, how to remove one datacenter completely from CDCR
1. stop elasticsearch nodes:
systemctl stop ver_elasticsearch

2. Remove the state on all nodes:
rm -rf /opt/veridiumid/elasticsearch/data/_state

3. set information about the cluster master nodes, accordingly
vi /opt/veridiumid/elasticsearch/config/elasticsearch.yml
cluster.initial_master_nodes: [ "dc1-node1", "dc1-node2", "dc1-node3" ]
also configure properly: discovery.seed_hosts with only these 3 nodes
comment the following lines:
##cluster.routing.allocation.awareness.force.zone.values: dc1, dc2

4. start the cluster on these 3 nodes

5. create API key and update websecadmin -> elasticsearch.json:
eops -x=GET -p=/_security/api_key
eops -x=PUT -p=/_security/api_key -d='{"name":"veridium"}'

6. set the number of replicas according to new infrastructure.
eops -x=PUT -p=/veridium.*/_settings -d='{"index":{"number_of_replicas":1}}'

7. connect to cassandra and truncate info about the cluster:
cqlsh
truncate table veridium.cdcr_datacenters
Backup :
Backup is done incrementally, for the data and needs to be executed on one node, in crontab. For more details, see article Troubleshooting - Disaster Recovery
Useful commands:
## list the indices
bash /opt/veridiumid/elasticsearch/bin/elasticsearch_ops.sh -l

## Check Cluster Health
eops -x=GET -p=/_cluster/health?level=indices

## Inspect Shards
eops -x=GET -p="/_cat/shards?v=true&h=index,shard,prirep,state,docs,store,node,unassigned.reason&s=state:desc"

##Identify unassigned shards
eops -x=GET -p="/_tasks?detailed=true&actions=*shard,*management"

##explain allocation
eops -x=GET -p="/_cluster/allocation/explain?pretty" -d='{"index":"dev682511251310.fido_devices-000001","shard":0,"primary":false}'

## get help for _cat commands
bash /opt/veridiumid/elasticsearch/bin/elasticsearch_ops.sh -x=GET -p=/_cat

## modify number of replicas
bash /opt/veridiumid/elasticsearch/bin/elasticsearch_ops.sh -x=PUT -p=/veridium.*/_settings -d='{"index":{"number_of_replicas":3}}'

## get nodes, indices, allocation of shards
bash /opt/veridiumid/elasticsearch/bin/elasticsearch_ops.sh -x=GET -p=/_cat/nodes?v
bash /opt/veridiumid/elasticsearch/bin/elasticsearch_ops.sh -x=GET -p=/_cat/indices?v
bash /opt/veridiumid/elasticsearch/bin/elasticsearch_ops.sh -x=GET -p=/_cat/allocation?v   ## here you can see how many shards need to be realocated
bash /opt/veridiumid/elasticsearch/bin/elasticsearch_ops.sh -x=GET -p=/_cat/shards         ## see how shards are allocated to each node
bash /opt/veridiumid/elasticsearch/bin/elasticsearch_ops.sh -x=GET -p=/_cluster/allocation/explain?pretty   ## shards realocation reasons

## delete an indices
bash /opt/veridiumid/elasticsearch/bin/elasticsearch_ops.sh -x=DELETE -p=/veridiumid.sessions-2023-03

##make and index readable
eops -x=PUT -p=/veridium.sessions-2023-08/_settings -d='{"settings":{"index.blocks.write":true}}'
###clone an index
eops -x=POST -p=/veridium.sessions-2023-08/_clone/veridiumbck.sessions-2023-08
##make and index writtable
eops -x=PUT -p=/veridium.sessions-2023-08/_settings -d='{"settings":{"index.blocks.write":false}}'

## copy the content of an index to the new index.
eops -x=POST -p=/_reindex -d='{"source":{"index":"veridium.sessions_history-2023-06"},"dest":{"index":"veridiumbck.sessions_history-2023-06"}}'

eops -x=DELETE -p=/veridiumbck.sessions_history-2023-06
eops -x=POST -p=/veridium.*/_flush

## get api key
eops -x=GET -p=/_security/api_key

## create api key
eops -x=PUT -p=/_security/api_key -d='{"name":"veridium"}'

##show hidden indices:
eops -x=GET -p=/_cat/indices/.*?v

## get cluster master nodes
 eops -x=GET -p=/_cluster/state?filter_path=metadata.cluster_coordination.last_committed_config
## REAL CASE EXAMPLE OF REINDEXING
## modify zookeeper content to be able to process elasticsearch data
eops -l | grep sessions-2025-12

eops -x=PUT -p=/veridium.sessions-2025-12/_settings -d='{"settings":{"index.blocks.write":true}}'
eops -x=POST -p=/veridium.sessions-2025-12/_clone/veridium.sessions-2025-12-02
## cloning operation took less then 10 secondes.
## with copy index, it did not work, as it was not able to convert the data
eops -l | grep sessions-2025-12
eops -x=POST -p=/_aliases -d='{"actions":[{"add":{"index":"veridium.sessions-2025-12-02","alias":"veridium.sessions"}}]}'

eops -x=DELETE -p=/veridium.sessions-2025-12

eops -x=PUT -p=/veridium.sessions-2025-12-02/_settings -d='{"index":{"number_of_replicas":3}}'