
-
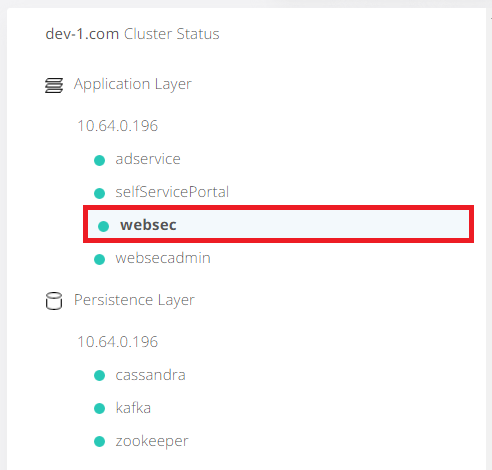
Monitoring details on various components resource usage and their operational times are available in Application Layer/ websec.
-
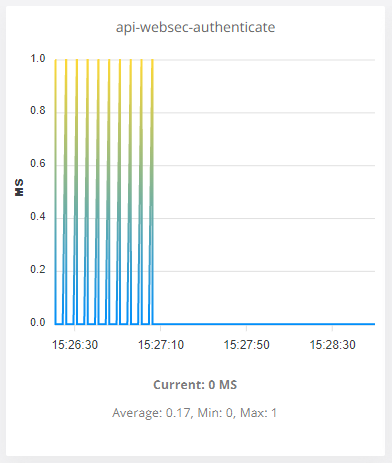
Chart is showing Authenticate response time.
-
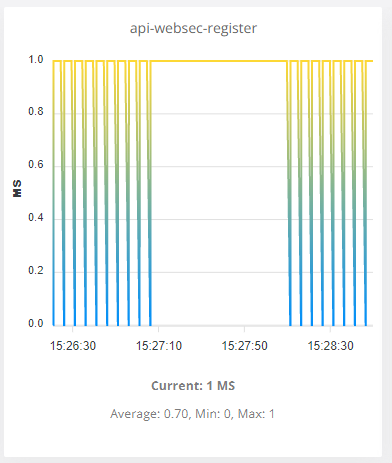
Chart is showing Register response time.
-
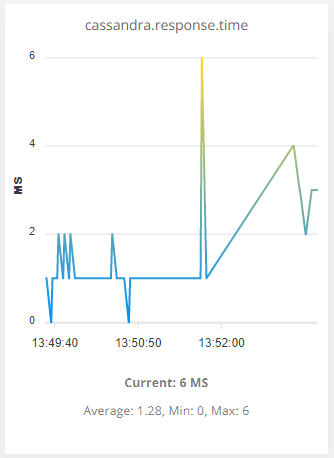
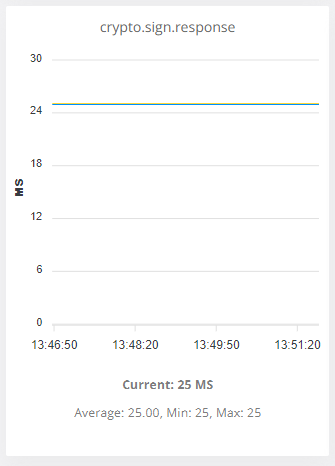
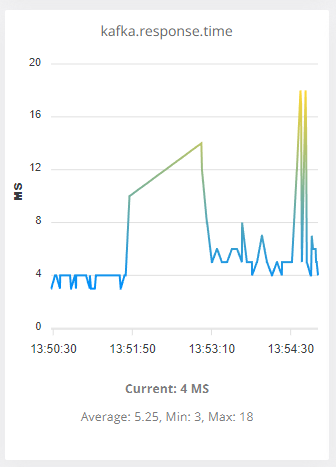
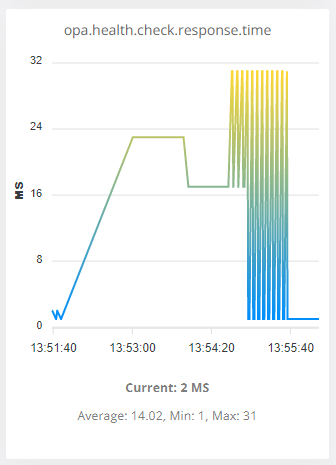
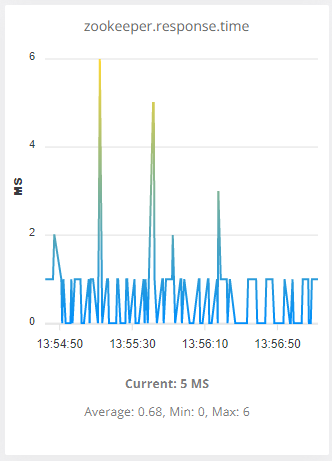
Websec Response Time contains Cassandra, Kafka, Health Check, Zookeeper and Crypto Sign metrics:
-
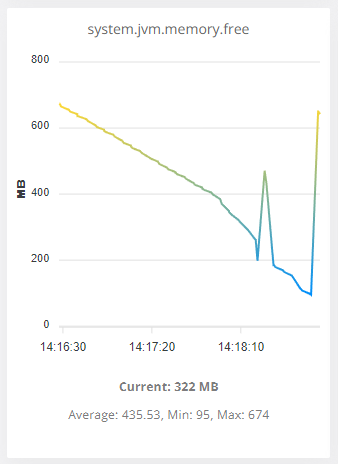
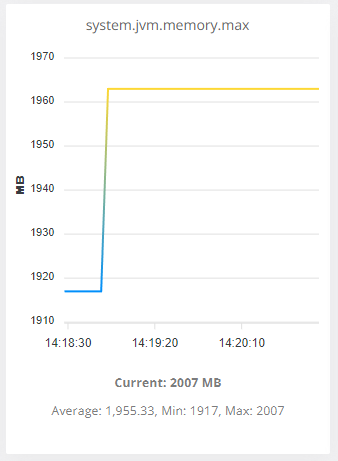
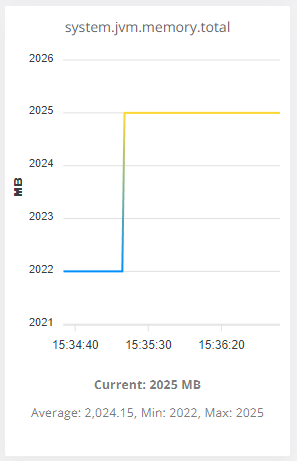
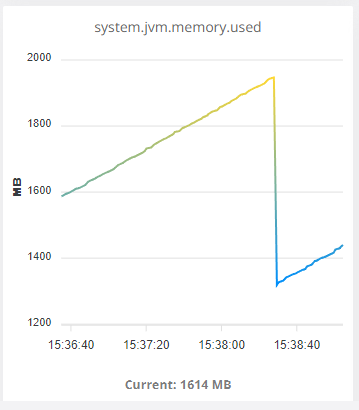
Memory Consumption is detailed as Free, Maximum, Total and Used: