Main Dashboard
Basic Statistics
The first part of the dashboard contains the following charts:
“Active users” shows the number of unique user identities that started an authentication session in the time frame specified by the dashboard.
“Number of Sessions” shows the number of authentication sessions started in the time frame specified by the dashboard.
“Windows Sessions” shows the number of authentication sessions started in the time frame specified by the dashboard, and performed through the Veridium Credential Provider
“IDP sessions created” shows the number of IDP sessions started in the time frame specified by the dashboard
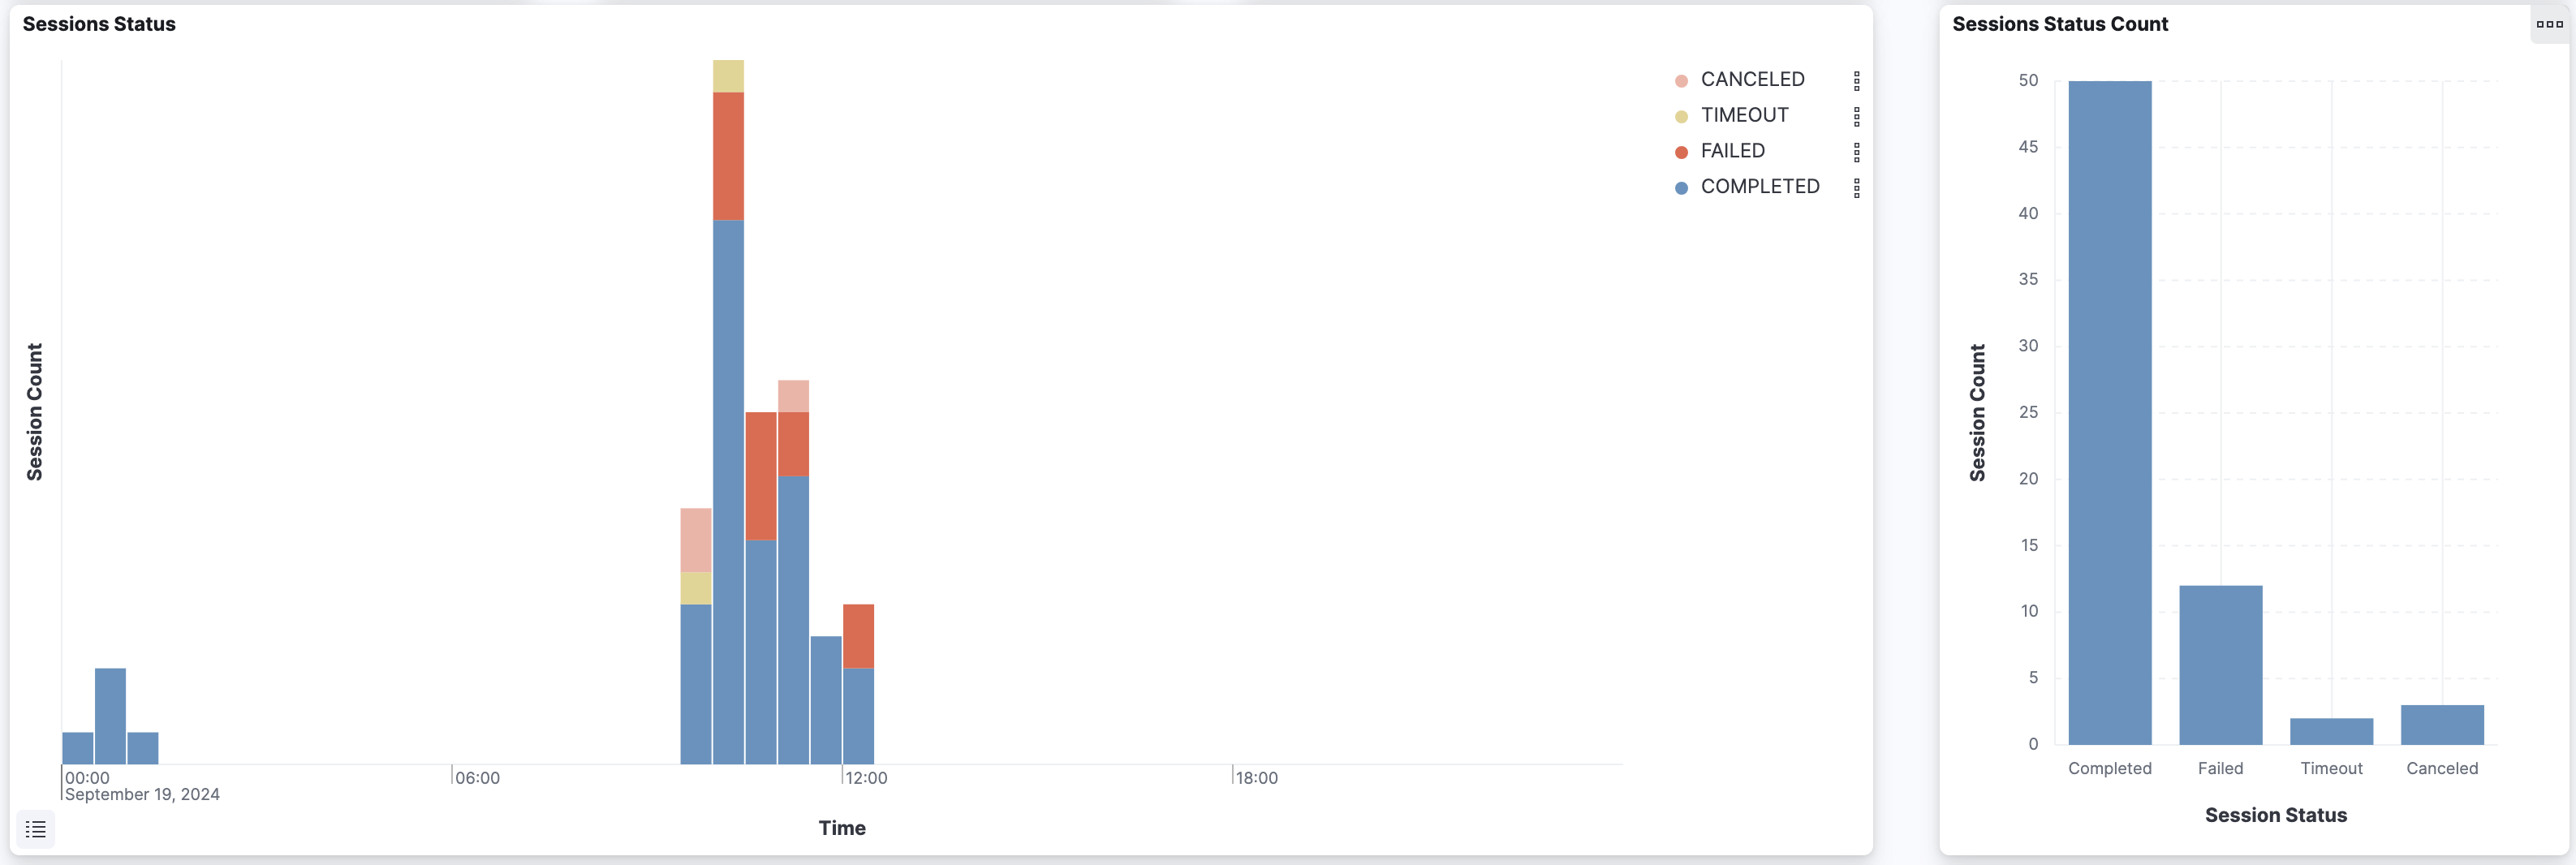
Authentication sessions bar chart provides an overview in time of the number of authentication sessions created, classified by their outcome
Sessions status count bar chart provides the number of authentication sessions for each possible status, over the entire period specified in the dashboard’s time frame


Session Location Statistics
This part contains two charts:
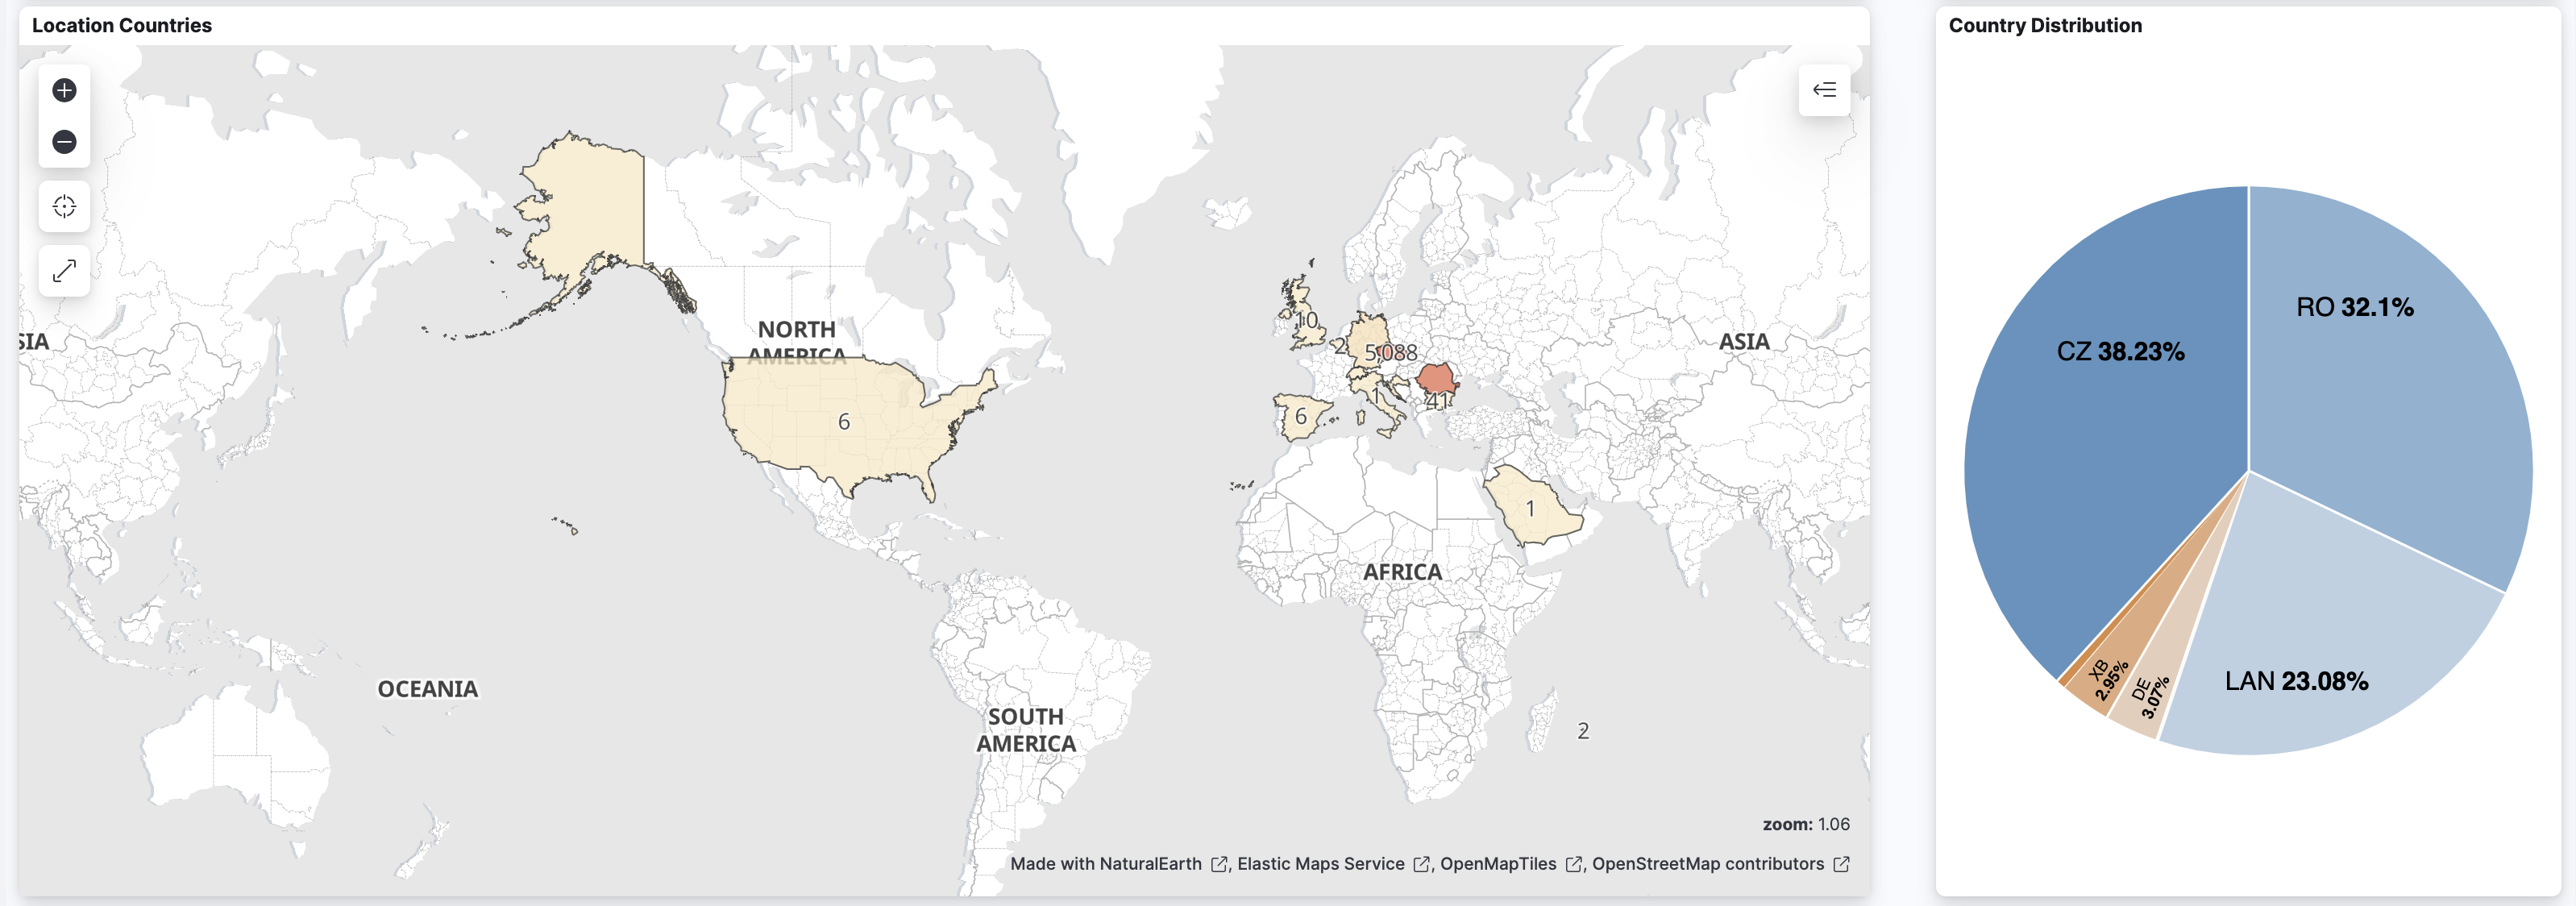
A country map of the sessions based on the location of the authenticator device
A pie chart containing the country distribution of the authenticator device location for each session

ILP context charts
This part contains two charts:
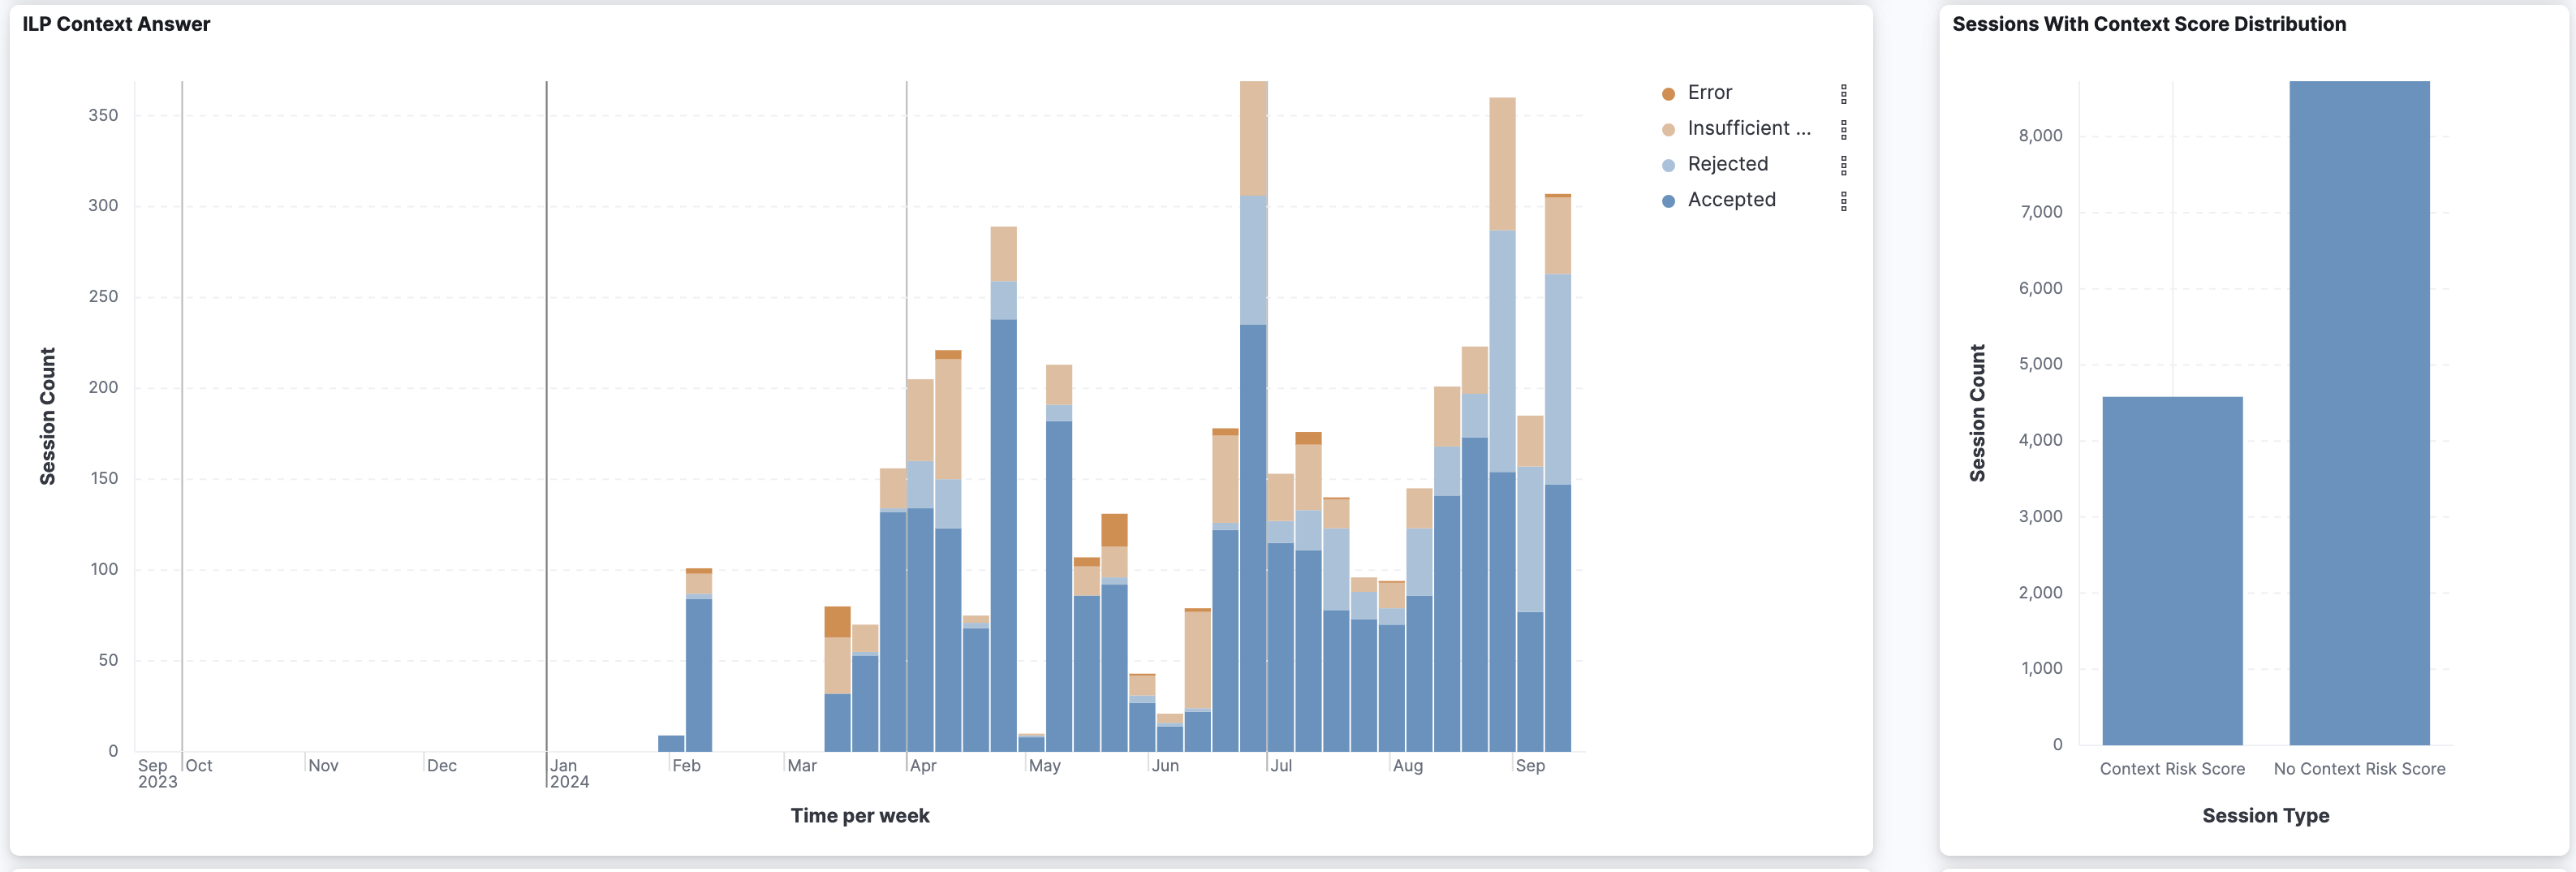
The Context Answer bar chart, showing the ILP context outcome for ILP enabled sessions
The Context presence distribution, which is a count bar chart showing how many sessions have an ILP context answer, and how many don’t

Account Block Actions
This part contains two charts:
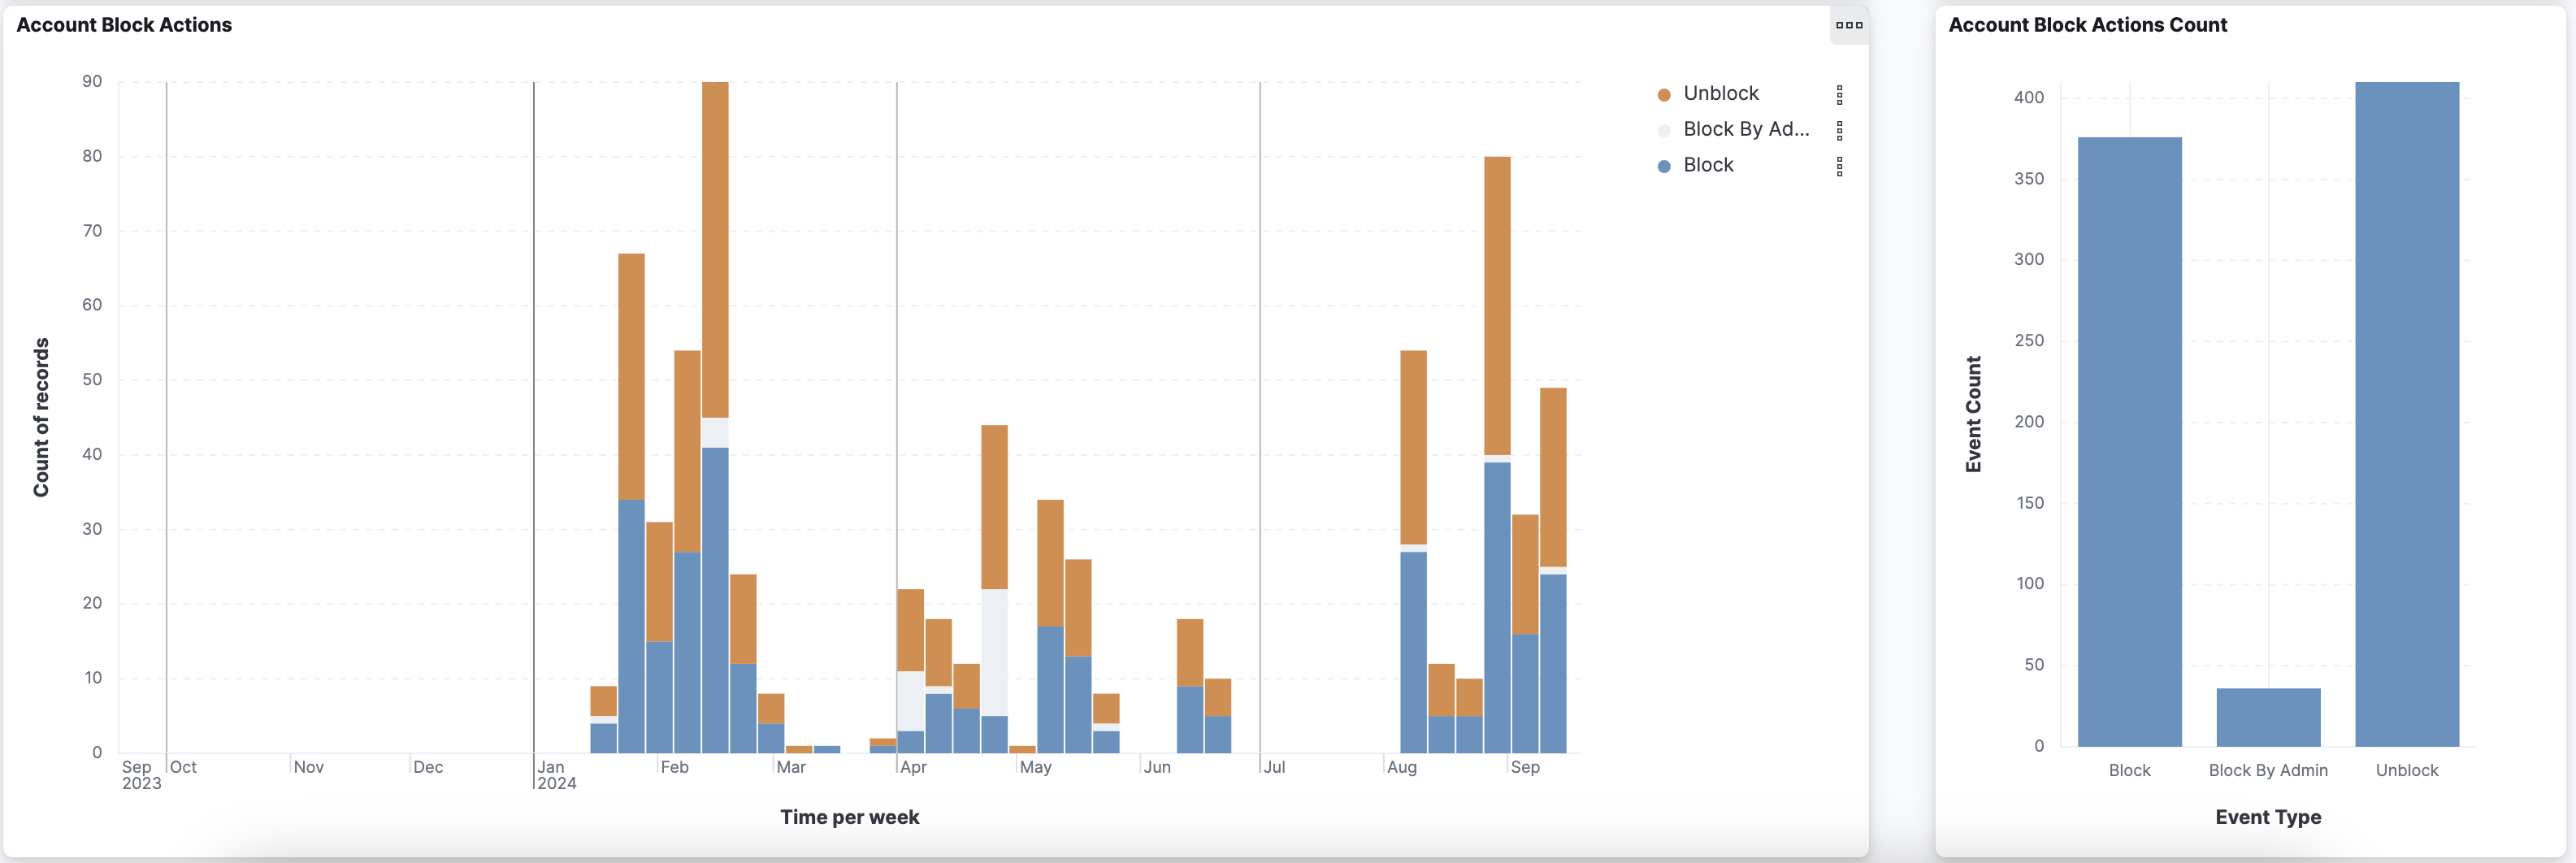
The “Account Block actions” bar chart, showing block-related actions performed on accounts. These may be the Unblock action or the Block action (either automatically or manually by an admin)
The “Account Block actions Count” count bar chart, showing the overall count of the same block-related actions on accounts.

