Desktop
This dashboard focuses on Desktop devices registered in the system
Basic Statistics
This part contains the following charts:
The “OS distribution” is a pie chart which shows the distribution of OS names
The “Status Distribution” is a pie chart which shows the distribution of device statuses for the currently registered Desktop devices (activated, blocked, etc.)
The “Certificate Expiration Time Distribution”is a pie chart showing the total number of devices having the certificate Valid (not expired and not expiring in the next 30 days), Expiring (not expired but expiring in the next 30 days), and Expired
The “Biometric Capabilities Distribution” is a non-mutually exclusive pie chart that shows how many of the registered devices are capable of each of the authentication methods.

Event Statistics
The following charts contain a bar chart for multiple types of events that happened on the devices during the dashboard’s selected time range.
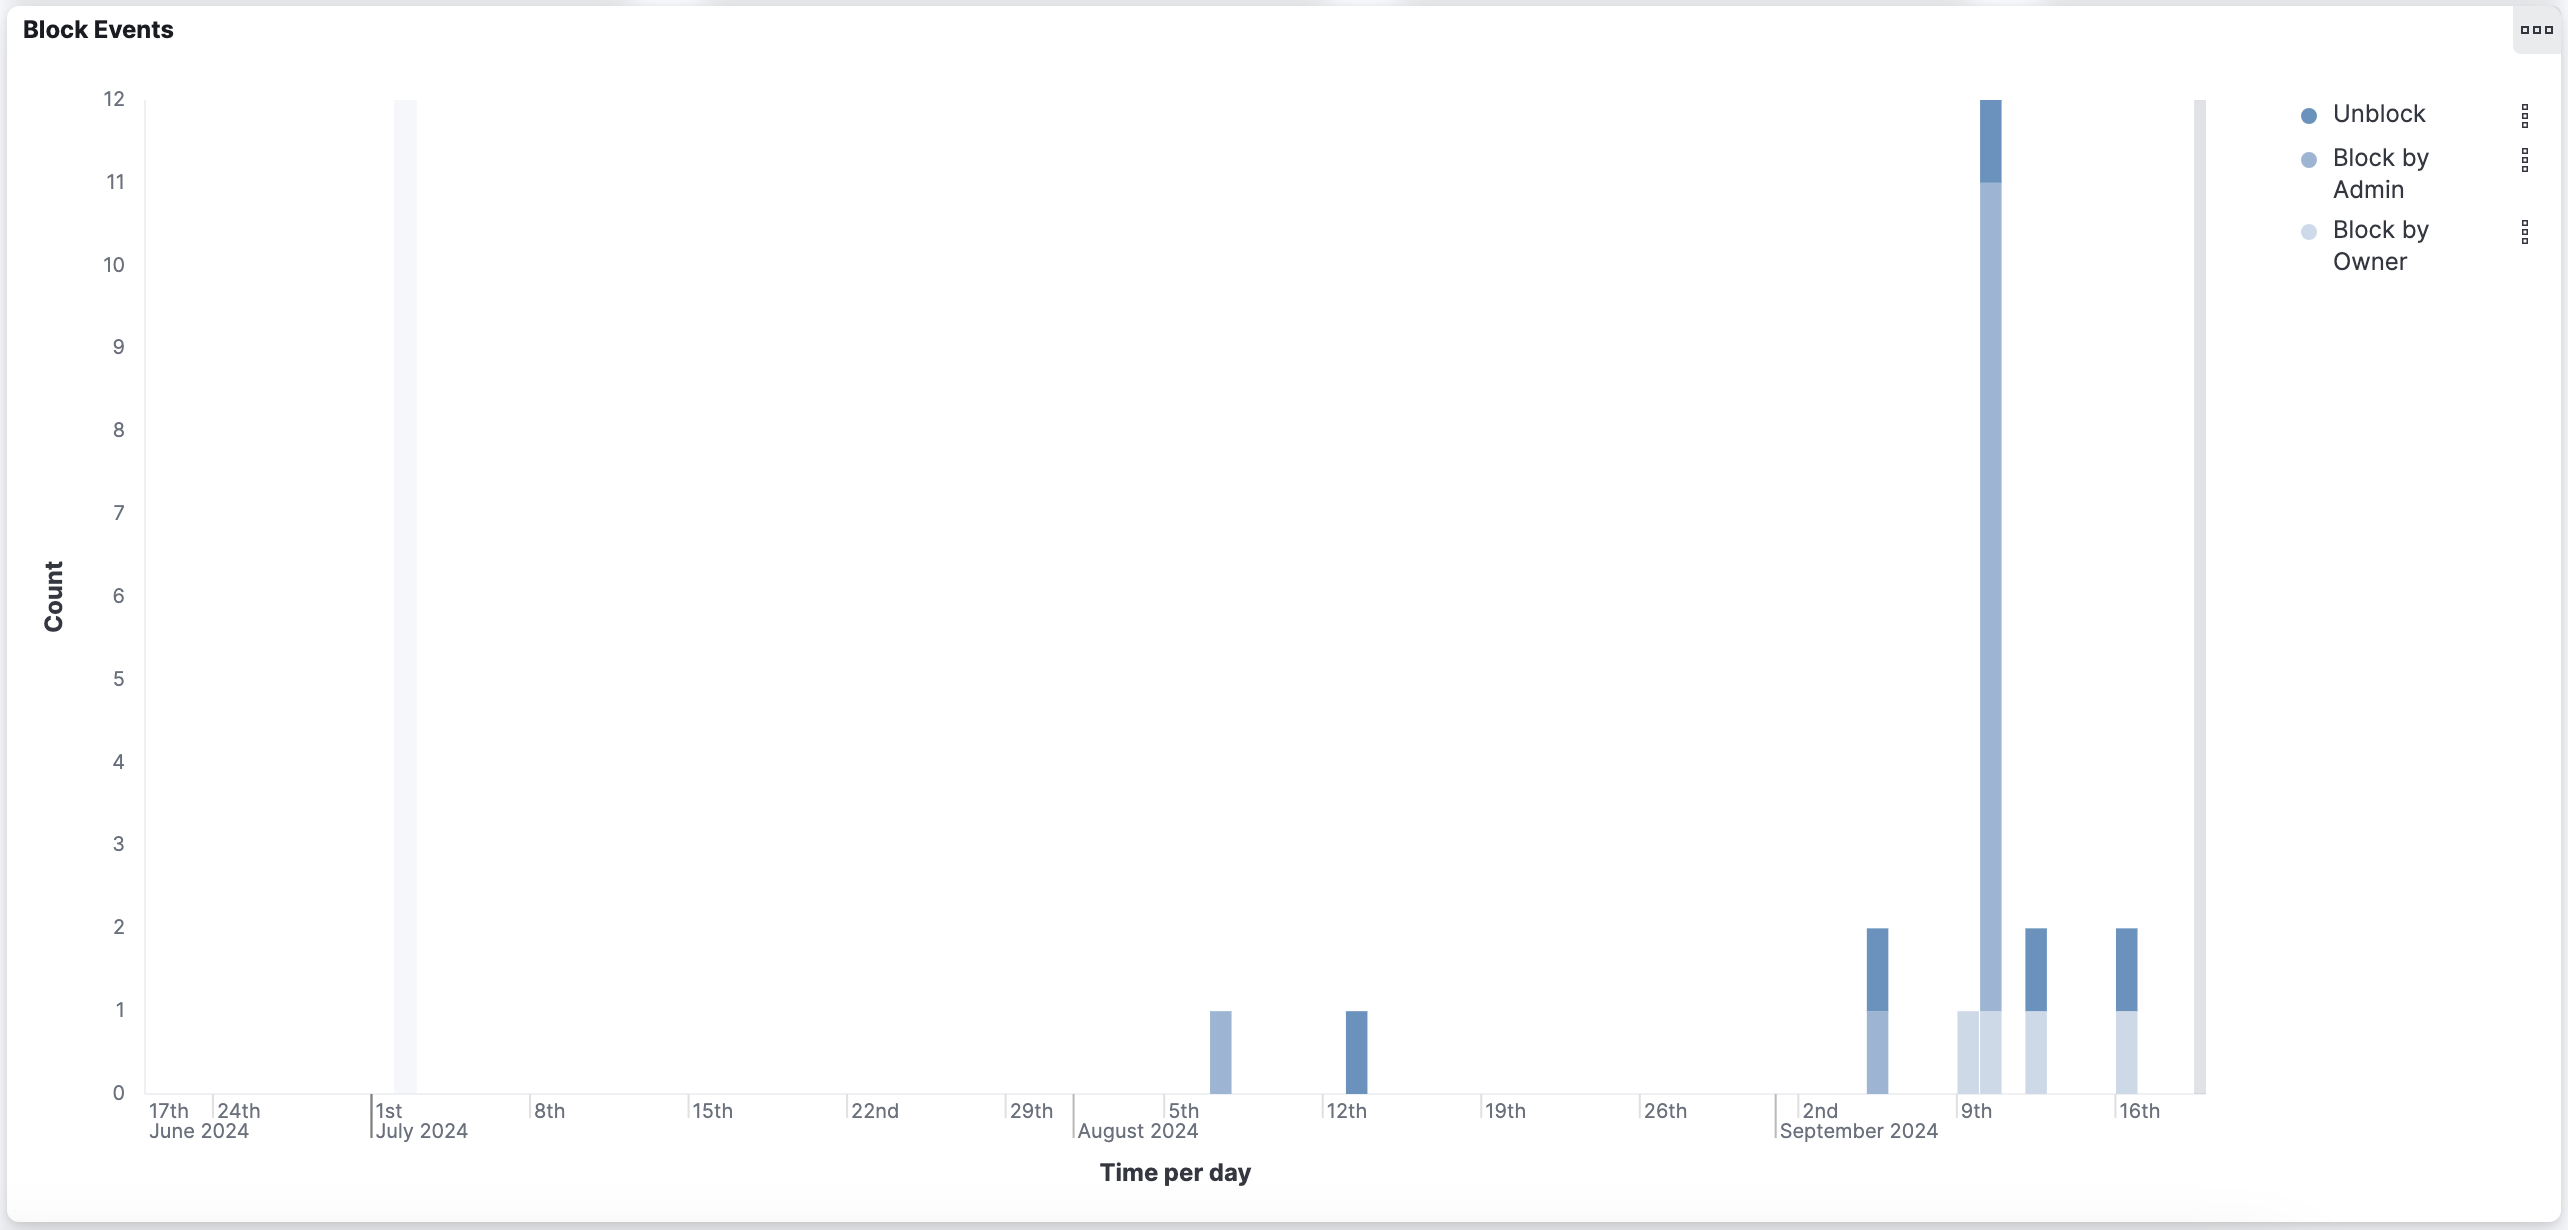
Block Events

This chart shows is related to the block operation that can be applied on a device. It presents how many Block operations where done (by admin or by owner) and how many unblock operations where performed.
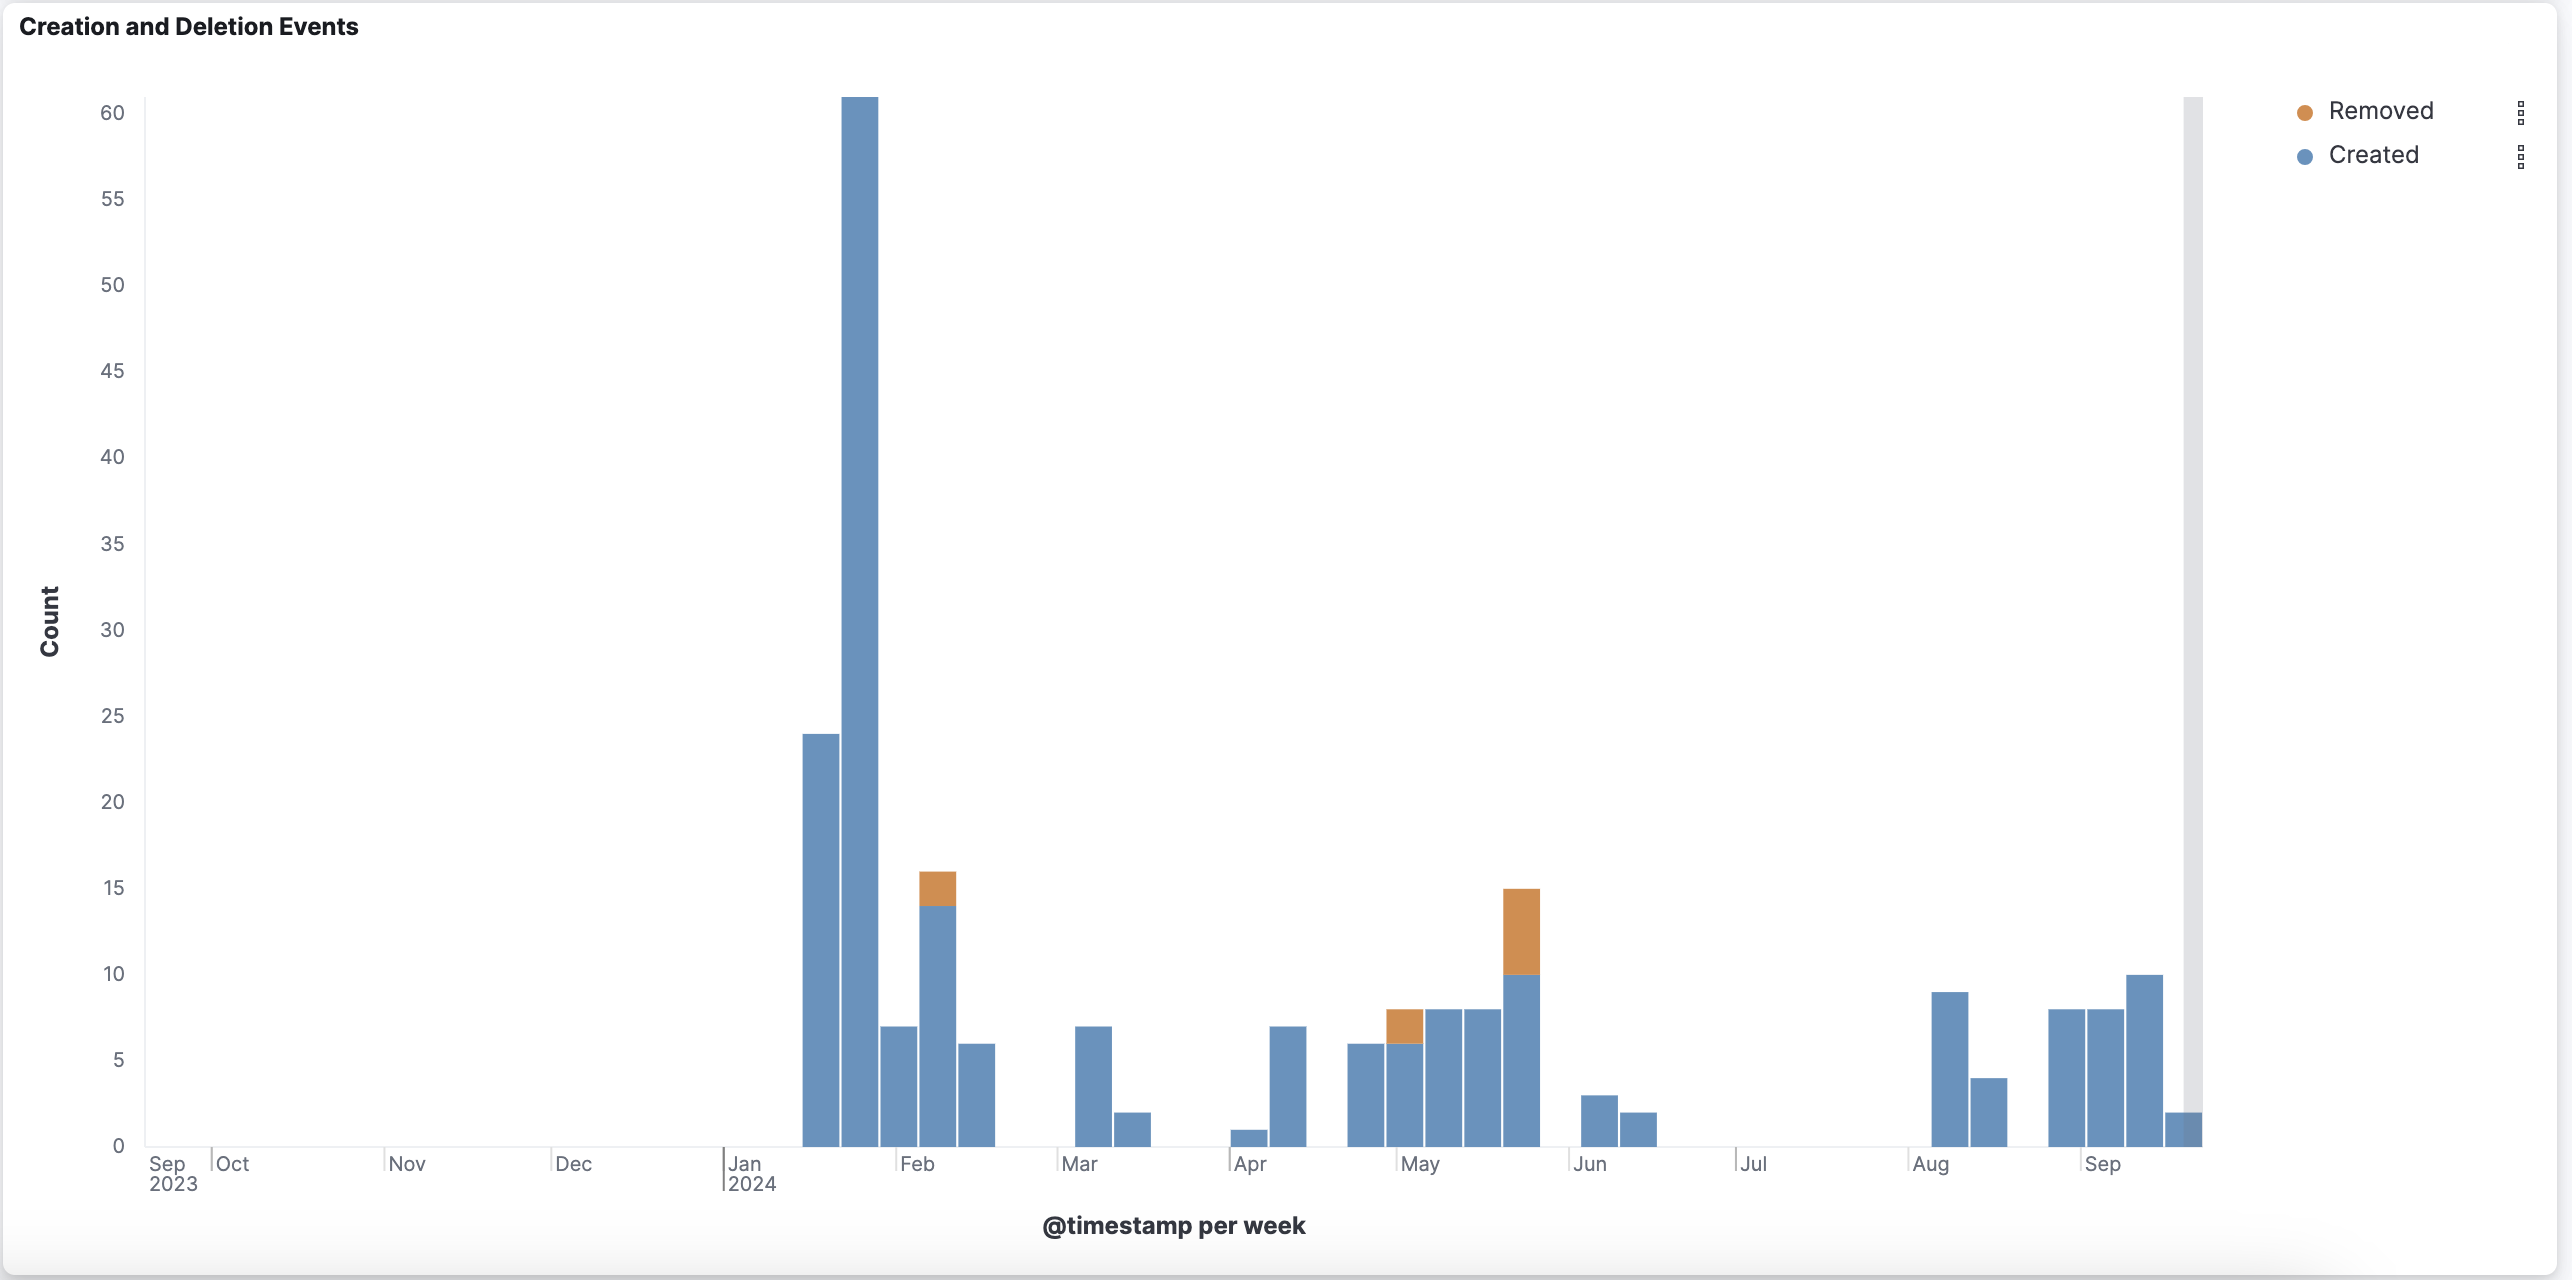
Creation and Deletion Events

This chart presents the count of events involving registering a new desktop device and removing a desktop device.
