
Disk
-
for Persistence should be used less than 75% at any time.
-
disk for WEBAPP should be used less then 85% at any time.
Memory
-
there should be always 1Gb memory free
CPU
-
the load on the server should be less then 75% at any time.
Services should be up and running
Liveness: it shows if the application has started
Readiness: it shows if the application has started successfully and is ready to be used. It returns 200 if everything is fine; it returns 503 - some dependencies are unavailable. It can run the following script (/etc/veridiumid/scripts/check_readyness.sh) to check the status on each server.
Metrics: it presents the response time of different services. The results can be found in files, if the variable enableFileStorage from websecadmin → settings → Advanced → metrics.json is set to true. See chapter VeridiumID Health Check mechanism, to setup different values for metrics thresholds.
Changing this value will need also a service restart (websecadmin and tomcat) so the values will be propagated to metrics.log files.
|
Application |
Liveness |
Readiness |
Metrics (REST API) |
Metric logs (file) |
|---|---|---|---|---|
|
websec |
/websec/rest/health/live |
/websec/rest/health/ready
|
/websec/rest/health/metrics/status |
/var/log/veridiumid/tomcat/metrics.log |
|
websecadmin |
/websecadmin/rest/health/live |
/websecadmin/rest/health/ready
|
/websecadmin/rest/health/metrics/status |
/var/log/veridiumid/websecadmin/metrics.log |
|
adservice |
/ADService/rest/health/live |
/ADService/rest/health/ready |
/ADService/rest/health/metrics/status |
/var/log/veridiumid/tomcat/metrics.log |
|
shibboleth |
/idp/profile/health/live |
/idp/profile/health/ready
|
/idp/profile/admin/metrics |
N/A |
|
ssp |
/ssp/rest/health/live |
/ssp/rest/health/ready
|
N/A |
N/A |
|
dmz |
N/A |
N/A |
||
|
opa |
/health *available only on 127.0.0.1 interface |
/health *available only on 127.0.0.1 interface |
/metrics *available only on 127.0.0.1 interface |
N/A |
|
fido |
/health/live *available only on 127.0.0.1 interface |
/health/ready *available only on 127.0.0.1 interface |
N/A |
N/A |
|
haproxy |
N/A |
N/A |
/haproxy?stats |
N/A |
Metric details:
Application - Metric API for each service.
The response should have the following parameters, and they should be within limits:
-
cassandra.response.timevalue less than 50 (if cassandra is down, this field will be missing) -
opa.health.check.response.time→ status true -
zookeeper.response.timevalue less then 50 -
if response code for this API is 503, the service websecadmin is unavailable.
-
this Api also presents for each application, it’s status true/false.
Metrics examples (from metrics.log file):
Elasticsearch is up - status = true; also there is presented the response time
2023-Jul-28 10:15:47 AM [ExportWorkerThread] DEBUG com.veridiumid.metrics.filestorage 2023-07-28T10:15:47.860Z, name=elastic.response.time, componentName=websecadmin-Develop-10.70.62.122, serviceName=websecadmin, serverIdentifier=Develop, ip=10.70.62.122, metricDescription=Elastic response time, metricUnit=MS, metricValue=3.0, tags={hostname=Develop, product-version=3.4.0, ip=10.70.62.122, target-hosts=10.70.60.248,10.70.61.181,10.70.62.122, product-build=8.1.16, built-on=28/07/2023, enabled=true, status=true}
zookeeper is up
2023-Jul-28 10:15:57 AM [ExportWorkerThread] DEBUG com.veridiumid.metrics.filestorage 2023-07-28T10:15:57.917Z, name=zookeeper.response.time, componentName=websecadmin-Develop-10.70.62.122, serviceName=websecadmin, serverIdentifier=Develop, ip=10.70.62.122, metricDescription=Zookeper response time, metricUnit=MS, metricValue=1.0, tags={hostname=Develop, product-version=3.4.0, ip=10.70.62.122, target-hosts=10.70.60.248:2181,10.70.61.181:2181,10.70.62.122:2181/veridiumid/8.1.16, product-build=8.1.16, built-on=28/07/2023, enabled=true, status=true}
Cassandra is up:
2023-Jul-28 10:15:52 AM [ExportWorkerThread] DEBUG com.veridiumid.metrics.filestorage 2023-07-28T10:15:52.888Z, name=cassandra.response.time, componentName=websecadmin-Develop-10.70.62.122, serviceName=websecadmin, serverIdentifier=Develop, ip=10.70.62.122, metricDescription=Cassandra response time in ms, metricUnit=MS, metricValue=2.0, tags={hostname=Develop, product-version=3.4.0, ip=10.70.62.122, target-hosts=10.70.60.248,10.70.61.181,10.70.62.122, product-build=8.1.16, built-on=28/07/2023, enabled=true, status=true}
AD service - checking each LDAP connection:
2023-Jul-28 03:27:11 AM [ExportWorkerThread] DEBUG com.veridiumid.metrics.filestorage 2023-07-28T03:27:11.683Z, name=ldap.query.response.time.qc, componentName=adservice-Develop-10.70.62.122, serviceName=adservice, serverIdentifier=Develop, ip=10.70.62.122, metricDescription=LDAP Query Response time in ms, metricUnit=MS, metricValue=2.0, tags={hostname=Develop, product-version=3.4.0, ip=10.70.62.122, product-build=8.1.15, built-on=27/07/2023, enabled=true, status=true}
2023-Jul-28 03:27:11 AM [ExportWorkerThread] DEBUG com.veridiumid.metrics.filestorage 2023-07-28T03:27:11.683Z, name=ldap.query.response.time.dev1, componentName=adservice-Develop-10.70.62.122, serviceName=adservice, serverIdentifier=Develop, ip=10.70.62.122, metricDescription=LDAP Query Response time in ms, metricUnit=MS, metricValue=18.0, tags={hostname=Develop, product-version=3.4.0, ip=10.70.62.122, product-build=8.1.15, built-on=27/07/2023, enabled=true, status=true}
OPA status:
2023-Jul-28 03:27:12 AM [ExportWorkerThread] DEBUG com.veridiumid.metrics.filestorage 2023-07-28T03:27:12.178Z, name=opa.health.check.response.time, componentName=websec-Develop-10.70.62.122, serviceName=websec, serverIdentifier=Develop, ip=10.70.62.122, metricDescription=OPA health check response time in ms, metricUnit=MS, metricValue=1.0, tags={hostname=Develop, product-version=3.4.0, ip=10.70.62.122, product-build=8.1.15, built-on=27/07/2023, enabled=true, status=true}
Metrics configuration
Metrics thresholds and limits can be viewed and configured in the Admin Dashboard, see image below:
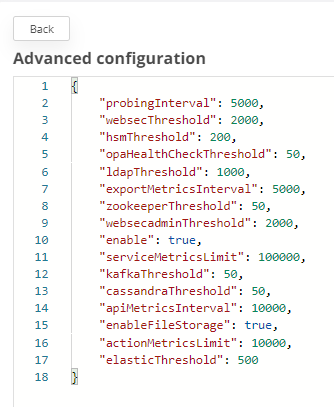
The metrics.json file contains the following values:
-
probingInterval:
-
how often, in miliseconds, the probes are executed.
-
-
enableFileStorage
-
setting this parameter to true, it will start writing logs to metric.log file
-
-
cassandraThreshold:
-
This parameter provides the current Threshold (in milliseconds) for response times from the Cassandra cluster to the VeridiumID node
-
Default value: 50
-
-
hsmThreshold:
-
Optional parameter, if not present it will not be used for status generation
This parameter provides the current Threshold (in milliseconds) for response times from the HSM to the VeridiumID node
-
Default value: 200
-
-
opaHealthCheckThreshold:
-
This parameter provides the current Threshold (in milliseconds) for response times from the VeridiumID node to OPA service
-
Default value: 50
-
-
elasticThreshold:
-
This parameter provides the current Threshold (in milliseconds) for response times from the VeridiumID node to Elasticsearch cluster
-
Default value: 50
-
-
zookeeperThreshold:
-
This parameter provides the current Threshold (in milliseconds) for response times from the Zookeeper cluster to the VeridiumID node
-
Default value: 50
-
-
kafkaThreshold:
-
This parameter provides the current Threshold (in milliseconds) for response times from the Kafka cluster to the VeridiumID node
-
Default value: 50
-
-
websecThreshold:
-
Optional parameter, if not present it will not be used for status generation
-
This parameter provides the current Threshold (in milliseconds) for response times for the RegisterAccount operations
-
Default value: 2000
-
-
websecadminThreshold:
-
Optional parameter, if not present it will not be used for status generation
-
This parameter provides the current Threshold (in milliseconds) for response times for basic Websecadmin calls
-
Default value: 2000
-
-
serviceMetricsLimit:
-
This parameter provides the limit of metrics reported by service monitoring should be kept in memory
-
Default value: 100000
-
-
actionMetricsLimit
-
This parameter provides the limit of metrics reported by action tracking should be kept in memory
-
Default value: 10000
-
-
metricsInterval:
-
This parameter provides the interval (in milliseconds) on which the metrics are calculated
-
Default value: 10000
-
Grok filters for parsing metrics data
The following filters can be used to parse entries in metrics.log file, depending on whether ‘status’ field is present:
    grok {
      match => { message => [
        "%{GREEDYDATA:_first_timestamp} \[%{DATA:thread}\] %{LOGLEVEL:loglevel} %{DATA:class} %{TIMESTAMP_ISO8601:timestamp}, name=%{DATA:name}, componentName=%{DATA:componentName}, serviceName=%{DATA:serviceName}, serverIdentifier=%{DATA:serverIdentifier}, ip=%{IP:ip}, metricDescription=%{DATA:metricDescription}, metricUnit=%{DATA:metricUnit}, metricValue=%{DATA:metricValue}, tags=\{hostname=%{DATA:hostname}, product-version=%{DATA:product-version}, %{GREEDYDATA:_tags}status=%{DATA:status}\}",
        "%{GREEDYDATA:_first_timestamp} \[%{DATA:thread}\] %{LOGLEVEL:loglevel} %{DATA:class} %{TIMESTAMP_ISO8601:timestamp}, name=%{DATA:name}, componentName=%{DATA:componentName}, serviceName=%{DATA:serviceName}, serverIdentifier=%{DATA:serverIdentifier}, ip=%{IP:ip}, metricDescription=%{DATA:metricDescription}, metricUnit=%{DATA:metricUnit}, metricValue=%{DATA:metricValue}, tags=\{hostname=%{DATA:hostname}, product-version=%{DATA:product-version}, %{GREEDYDATA:_tags}\}"
      ] }