VeridiumID Health Check mechanism
This page will explain the procedure of configuring the health check mechanism to be used by load balancers.
Metrics configuration
Metrics thresholds and limits can be viewed and configured in the Admin Dashboard, see image below:
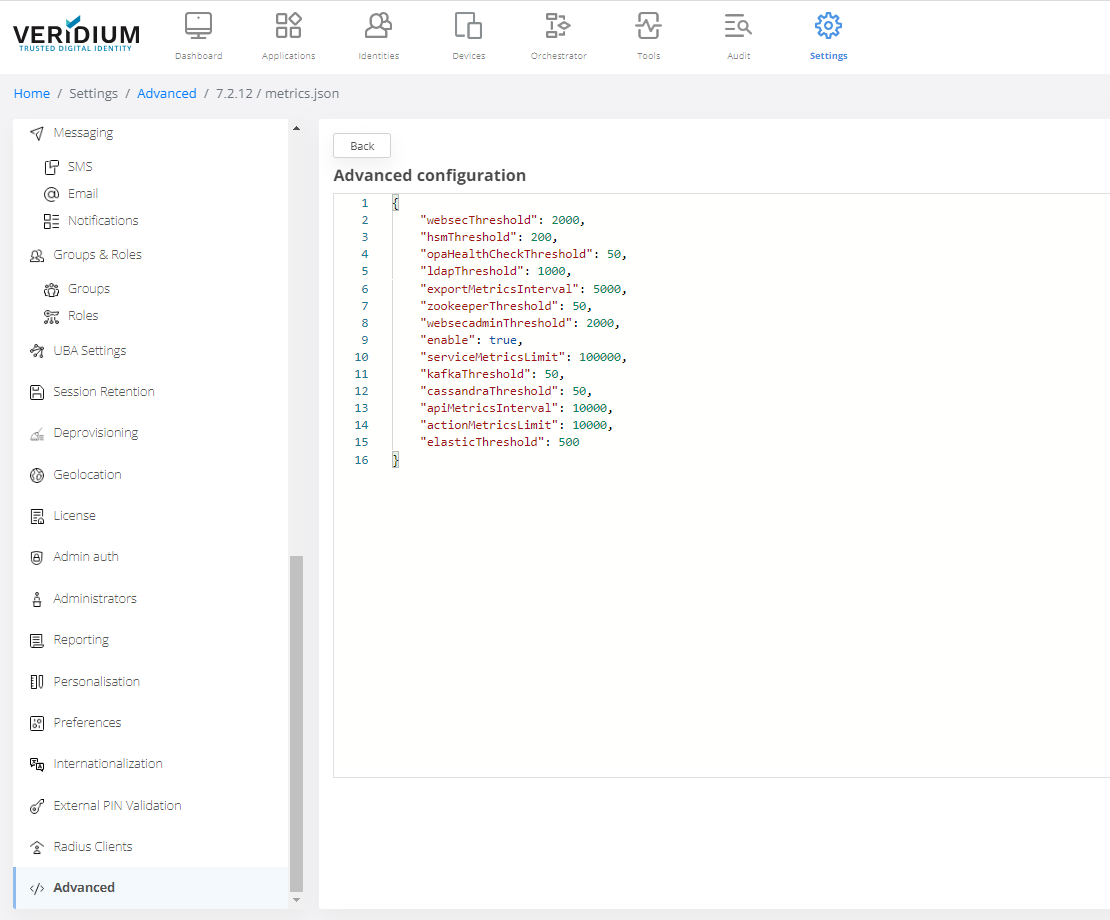
The metrics.json file contains the following values:
- cassandraThreshold:
- This parameter provides the current Threshold (in milliseconds) for response times from the Cassandra cluster to the VeridiumID node
- Default value: 50
- hsmThreshold:
- Optional parameter, if not present it will not be used for status generation
- This parameter provides the current Threshold (in milliseconds) for response times from the HSM to the VeridiumID node
- Default value: 200
- opaHealthCheckThreshold:
- This parameter provides the current Threshold (in milliseconds) for response times from the VeridiumID node to OPA service
- Default value: 50
- elasticThreshold:
- This parameter provides the current Threshold (in milliseconds) for response times from the VeridiumID node to Elasticsearch cluster
- Default value: 50
- zookeeperThreshold:
- This parameter provides the current Threshold (in milliseconds) for response times from the Zookeeper cluster to the VeridiumID node
- Default value: 50
- kafkaThreshold:
- This parameter provides the current Threshold (in milliseconds) for response times from the Kafka cluster to the VeridiumID node
- Default value: 50
- websecThreshold:
- Optional parameter, if not present it will not be used for status generation
- This parameter provides the current Threshold (in milliseconds) for response times for the RegisterAccount operations
- Default value: 2000
- websecadminThreshold:
- Optional parameter, if not present it will not be used for status generation
- This parameter provides the current Threshold (in milliseconds) for response times for basic Websecadmin calls
- Default value: 2000
- serviceMetricsLimit:
- This parameter provides the limit of metrics reported by service monitoring should be kept in memory
- Default value: 100000
- actionMetricsLimit
- This parameter provides the limit of metrics reported by action tracking should be kept in memory
- Default value: 10000
- metricsInterval:
- This parameter provides the interval (in milliseconds) on which the metrics are calculated
- Default value: 10000
Optional parameters will be added manually.
Adding/modifying optional parameters requires service (Websecadmin and Tomcat) restart.
Metrics endpoints
There are three endpoints that will be used for metrics:
- http://{{ IP/FQDN}}:{{ INTERNAL_PORT }}/websecadmin/rest/health/metrics
- This endpoint will provide the metrics that are calculated by Websecadmin
- http://{{ IP/FQDN}}:{{ INTERNAL_PORT }}/websecadmin/rest/health/metrics/status
- This endpoint will provide the metrics that are calculated by Websecadmin and a status for the service
For example:
https://admin-local.myhost.com/websecadmin/rest/health/metrics