Monitoring tools
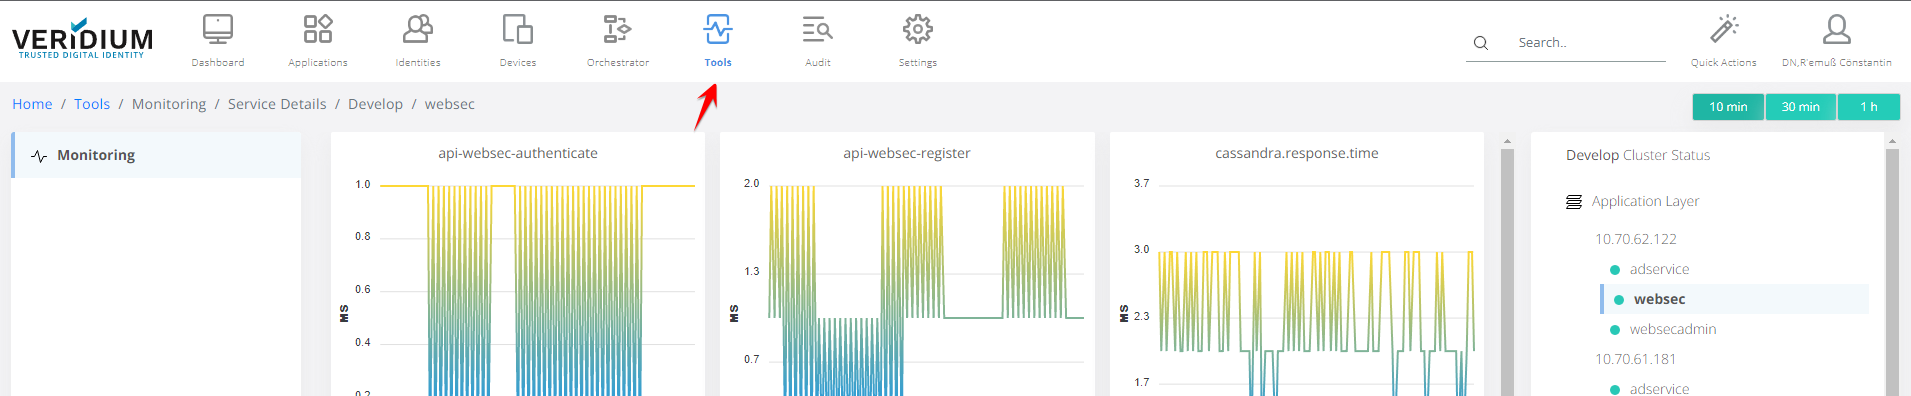
Monitoring shows actual operational logs for each VeridiumID server component and charts are showing service availability, response times, memory and CPU usage. Time filtering is available for each metric to follow the evolution on a desired time bracket.
These are available in Veridium Manager - Tools menu: